July 7, 2022
By Cavan Merski, data analyst, Pecan Street
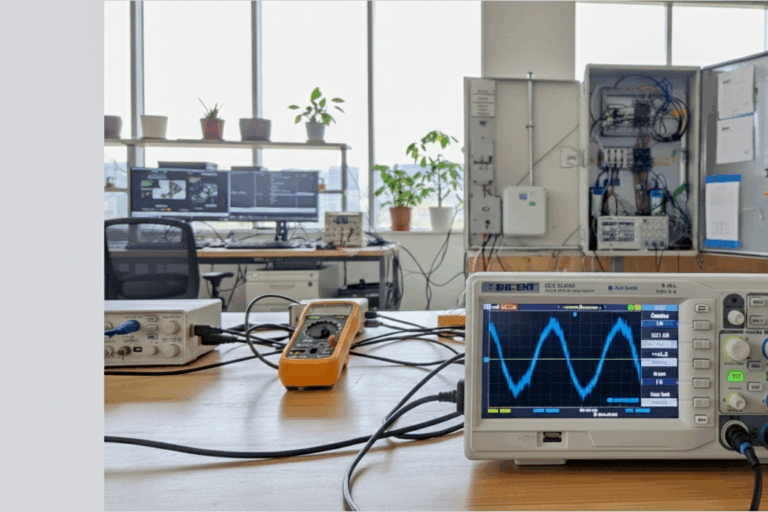
Pecan Street’s energy data accelerates clean energy innovation by enabling detailed research and analysis. Researchers can instantly connect with the billions of data points that our circuit-level electricity monitoring devices collect continuously from our volunteer research participants’ homes. To allow better access and more sophisticated analysis of this data, we launched our own Jupyterhub, a multi-user server for Jupyter Notebooks designed to support large-scale analysis by using GPU and memory based on a server rather than a local machine.
It also allows multiple users – like groups of students or researchers – to share the same document at the same time. Jupyter Notebooks are web-based tools that allow users to interactively develop, document, execute code and share their results, visualizations, and documentation. Because they support multiple languages, researchers can easily code in multiple languages like R and Python side by side. This lets users integrate, test, and reuse code quickly and easily. Code libraries are easy to add and rapid testing and debugging help develop code quickly. Our Jupyterhub supports high-powered analysis and seamless parallel development at a scale that wasn’t possible with individual Jupyter notebooks alone.
As a Pecan Street analyst and researcher, I use our JupyterHub when using Pecan Street datasets manipulating millions of records to scale my analysis. I also use it to share my work with team members and others in the broader research community. The latest example of this work shows how we queried, cleaned, and analyzed data for our comparative HVAC analysis between homes in Austin, TX and Ithaca, NY. My blog post links to the paper and our interactive dashboard showing the dataset and results. Run on an individual computer, this type of analysis would normally bog down my workflow. But with the GPU and memory resources in Pecan Street’s JupyterHub, it was quick and easy to perform many operations on extremely large datasets.
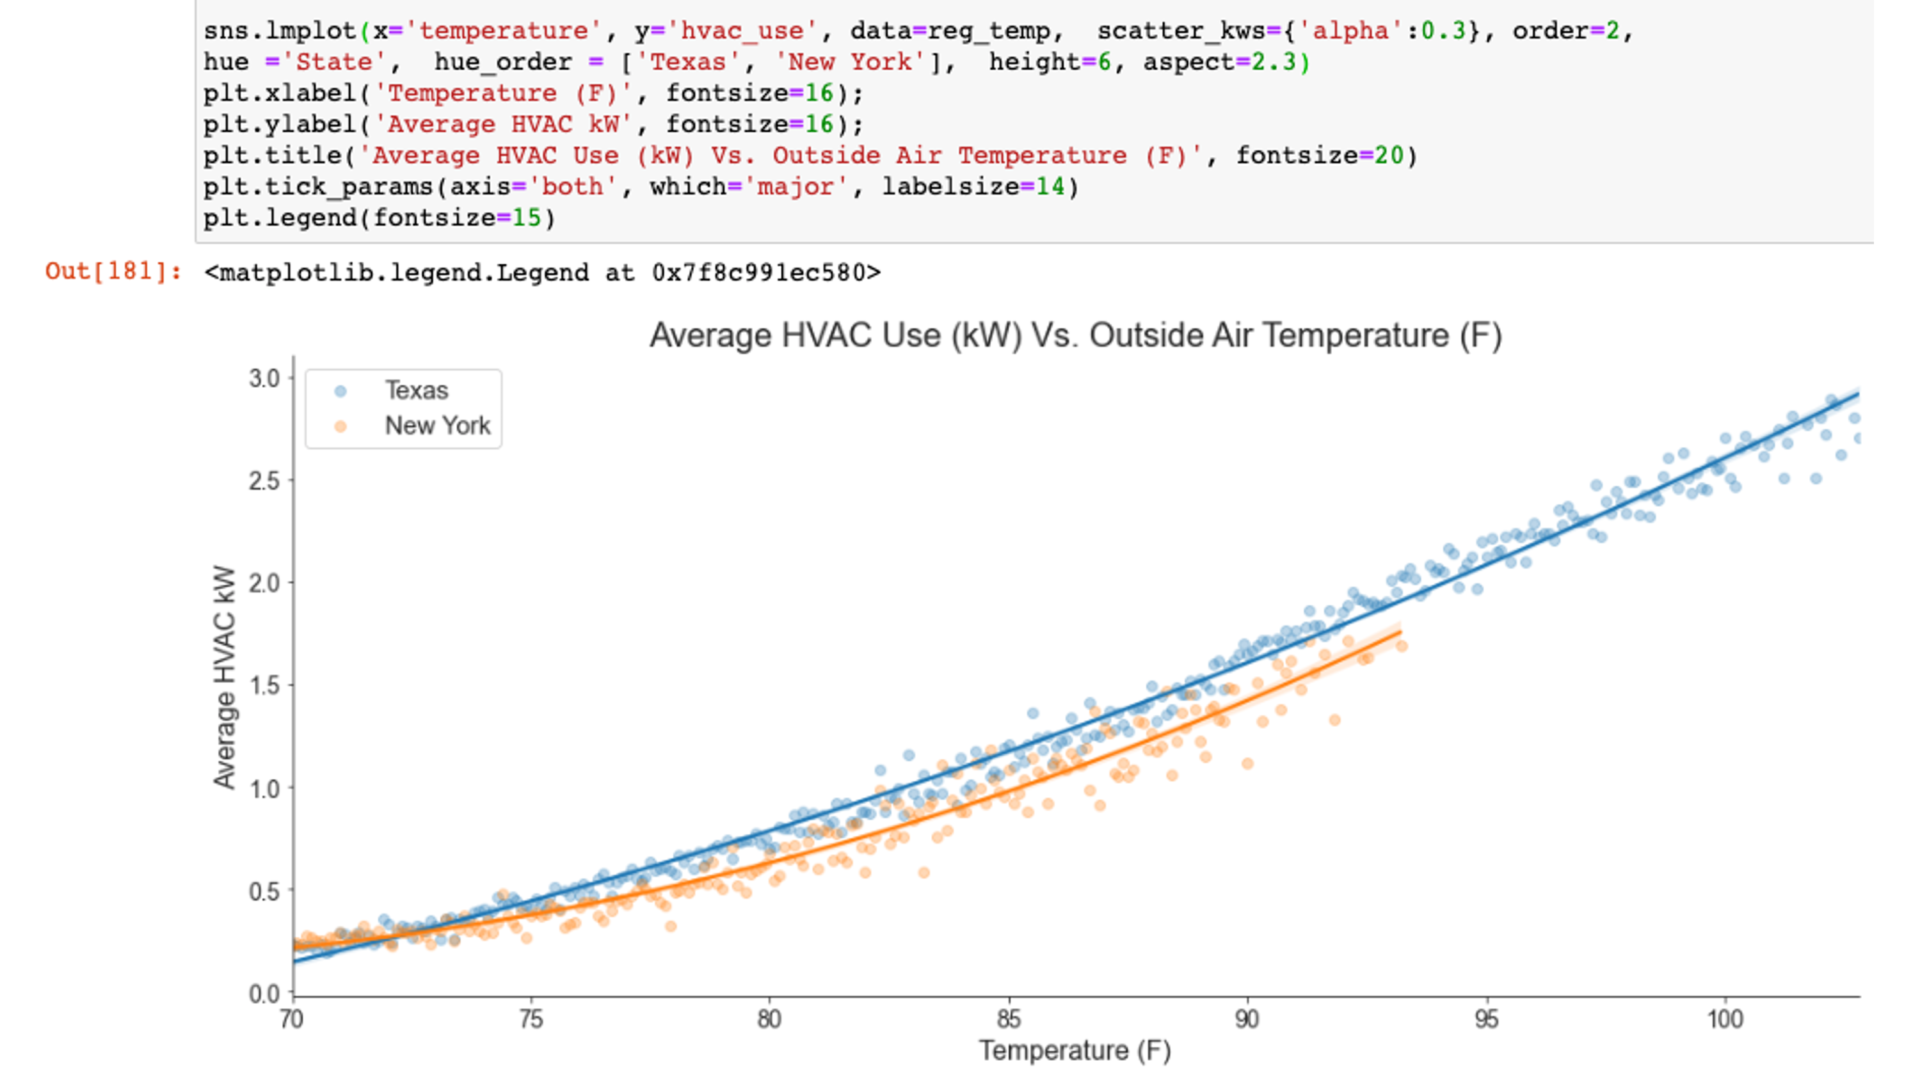
The analysis itself is in a notebook titled ‘Comparative HVAC Analysis’ and can be found in the HVAC folder of Pecan Street’s Github repository. With a Dataport license, you can view and edit the code in the notebook to customize your own research questions. This notebook shows how easy it is to query, clean, analyze and visualize our data all in one place. Beyond this, our JupyterHub allows you to collaborate with your team and iterate your code at scale. Take a look through our notebook and see for yourself how Pecan Street’s data and JupyterHub’s scale can take your research and analysis to the next level.
Dataport JupyterHub is open to all current Dataport license holders. Free and paid license holders can log in using their current Dataport username and password. New Dataport users need to register first.