


Example Analysis & Case Studies
Better Data Leads to Better Insights
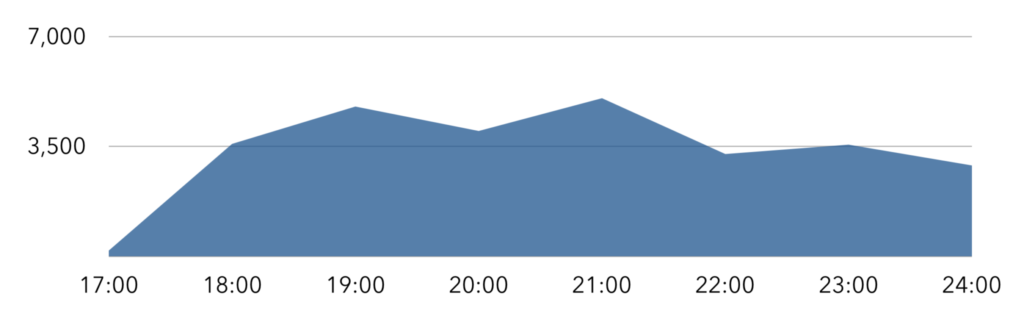
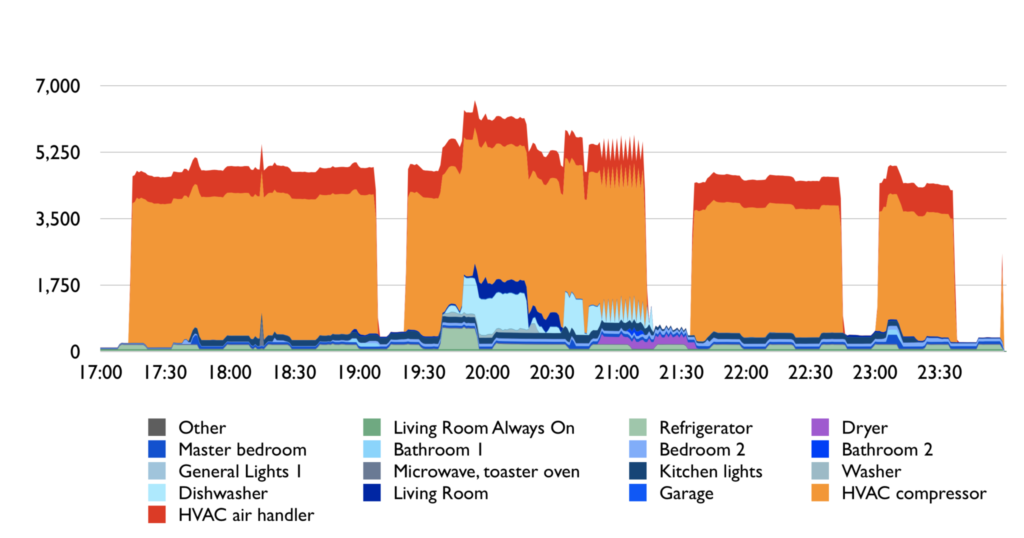
The difference between common one hour, whole-home energy data and Pecan Street’s high frequency, disaggregated data is dramatic. The first chart shows whole-home, one-hour energy data between 5 pm and midnight – the kind of data readily available from advanced electric meters. The second chart shows energy use in a home in Pecan Street’s research network. Data was collected every minute from multiple circuits in the home, giving an incredible minute-by-minute understanding of when — and how — electricity was used.
Examples and Case Studies
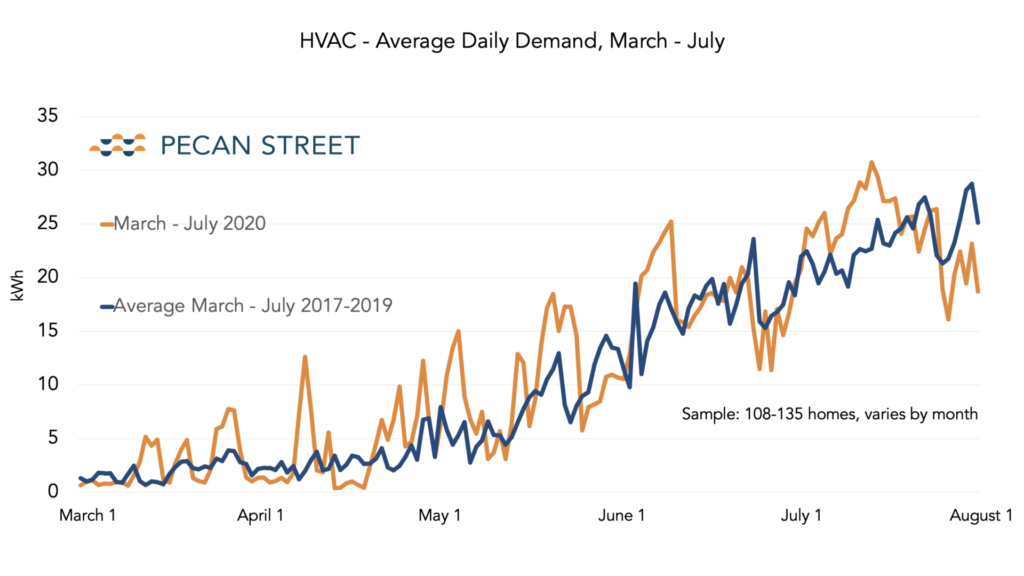
Analyzing the impact of COVID-19 on home energy use
Pecan Street’s high resolution energy data provides unique insights into how stay-at-home orders and other COVID behavior changes have changed residential energy use.
learn more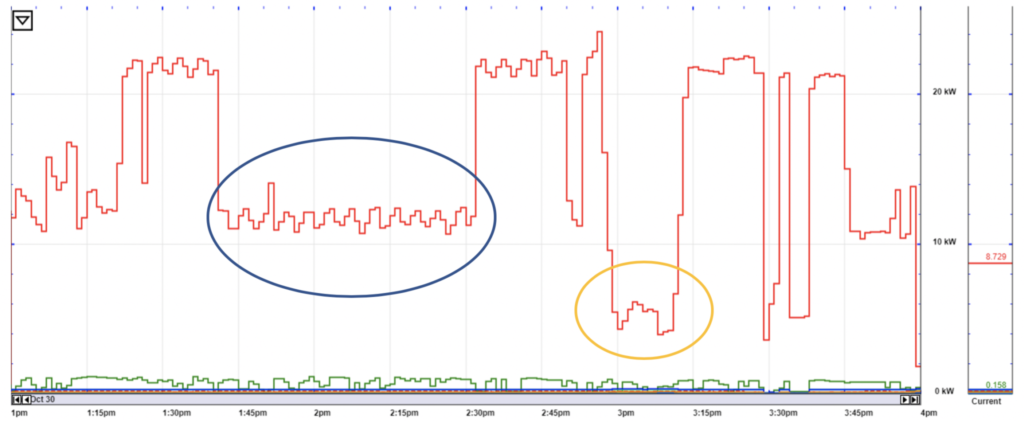
Testing the efficacy of Vehicle-to-Grid (V2G) Technology
As part of Austin Energy’s DOE-funded Austin SHINES project, Pecan Street designed, managed and analyzed the performance of using energy from an electric vehicle as a dispatchable grid resource.
learn more