August 26, 2020
 By Scott Hinson, chief technology officer, Pecan Street
Five months after we first documented the impact of COVID on residential electricity use, the data still show that we’re using more.
Watch the recording of our webinar on this topic on YouTube here.
Pecan Street has been monitoring electricity use and generation from hundreds of homes in our research network for nearly a decade. Many of these homes have rooftop solar and electric vehicles, and we’ve been measuring each home’s total energy use as well as use from individual circuits, like heating/cooling, EV charging, refrigerator, etc. With all this data at our fingertips, we decided to take a look at how our participants’ energy profiles have changed during the COVID-19 pandemic.
Last spring, you may have read our blogs or watched our webinar about how home energy use was changing at the beginning of the pandemic. From plummeting EV charging to a not-so-surprising uptick in the number of times the refrigerator door was opened, we took a deep dive into home energy use that only our high fidelity, one-second interval data could provide. After a summer of quarantine, we’ve updated our analysis.
Several months in, the realities of life during a prolonged global pandemic are more apparent, as are our new at-home behaviors and their effects on energy use. Some trends have shown signs of returning to normal; others are still far from average.
The charts below illustrate energy data from homes in our research network, all of which are located in the Mueller neighborhood in Austin, TX. Among the homes included in these charts, up to 74 of the homes have rooftop solar and up to 44 have Level II electric vehicle chargers. We selected homes for which we have data from at least three previous years so we can see how trends differ given the range of weather patterns we experience in Texas throughout the year.
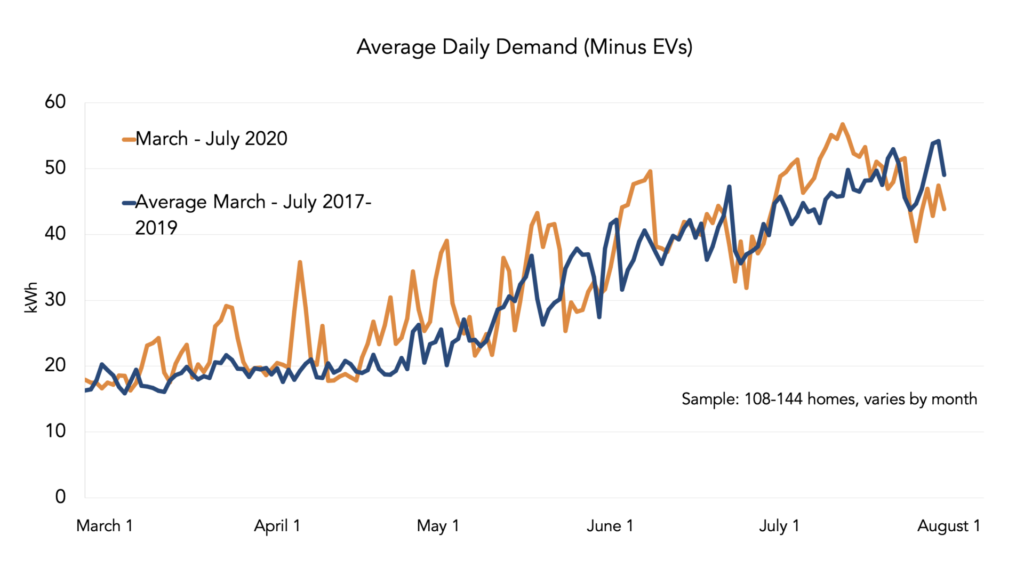
Total Residential Demand Is Up
Whole home average energy use has been consistently higher than normal since shelter in place began in mid-March. Compared to the average of the three previous years, March through July 2020 has produced 103 days of above average energy use and only 49 days of below average energy use. That increase is roughly equivalent to 10 days of average energy use from previous years. We continue to see a strong correlation between energy use and weather, a correlation that’s exacerbated by more people being at home during the warmest part of the day.
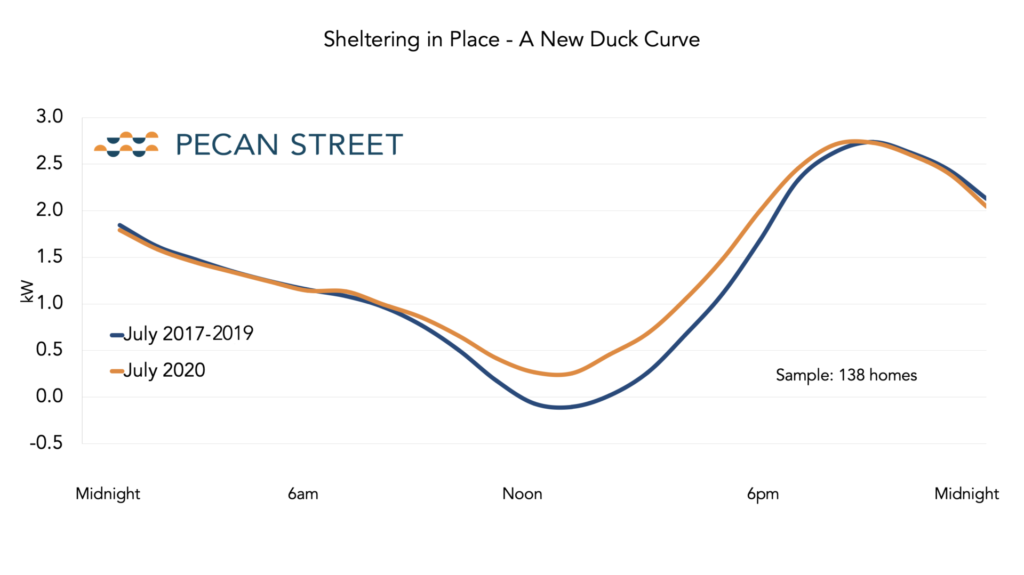
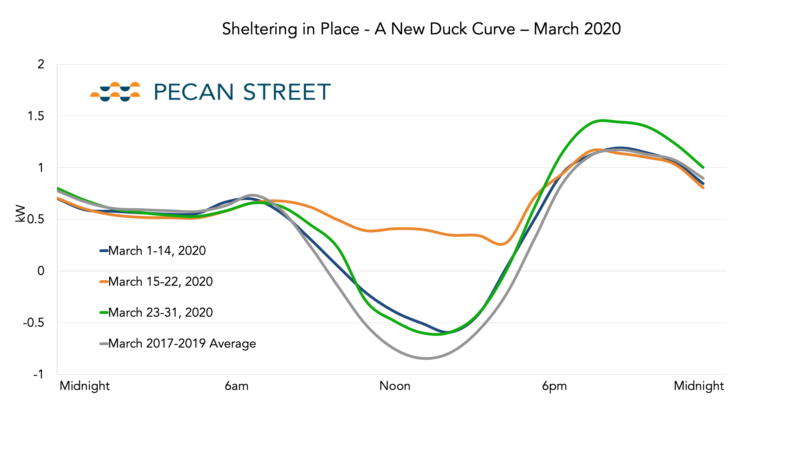
COVID-19 is Changing the Duck Curve
This spring, we saw significant changes to the fabled duck curve for the homes in our sample, and we see this trend holding true throughout the summer. Our analysis shows a consistent reduction in “sell back” energy exports due to excess usage in homes during the day. This skinnier duck has interesting ramifications for increased adoption of solar. The skinnier the belly around noontime and the more gradual the ramp up in late afternoon, the easier it is for grid managers to integrate intermittent resources like rooftop solar into the grid.
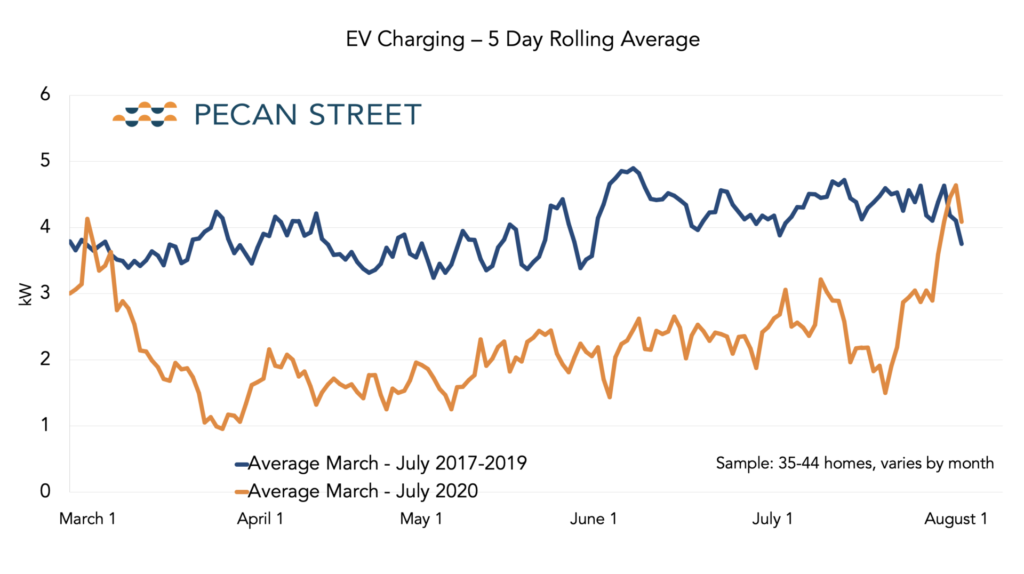
EV Chargers are Getting a Rest
One of the most drastic changes we have observed has been the sustained reduction in EV charging. We compared the 5-day rolling averages from March-July 2020 to previous years to account for any variations from differing charging behaviors on different days of the week. The 2020 average shifts back to something resembling normal behavior for the last few days of July. Further analysis of August charging data will allow us to determine if this was an anomaly or if charging behaviors are returning to normal.
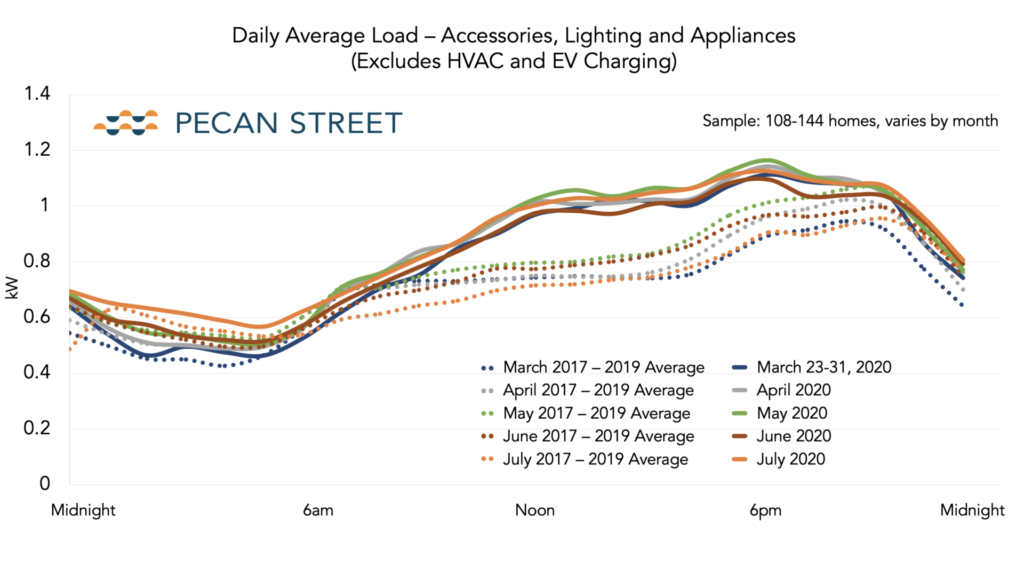
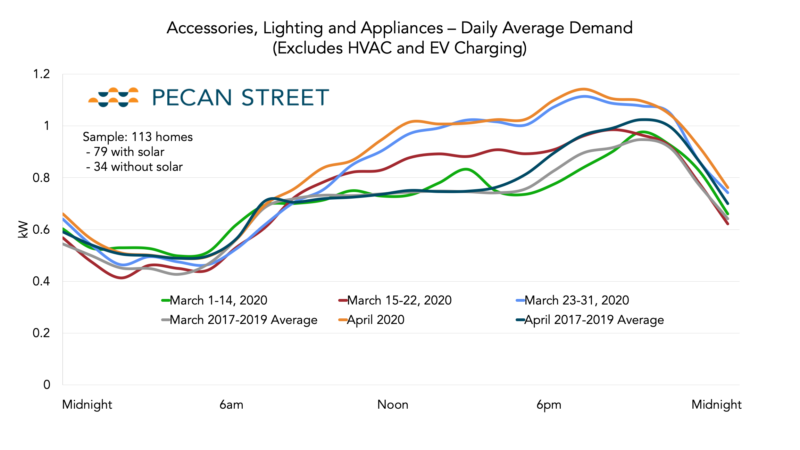
Accessory Use is Up, Uniformly
EVs and air conditioners most homes’ largest loads, but what about everything else? As it turns out, we use those appliances a lot more when we stay home. Compare the dotted trend lines from previous years to the solid trend lines from this year. Not only are we using these appliances more, but we also see less variation from month to month in how much energy we use when compared to previous years. We’ll call this the Ground Hog Day effect.
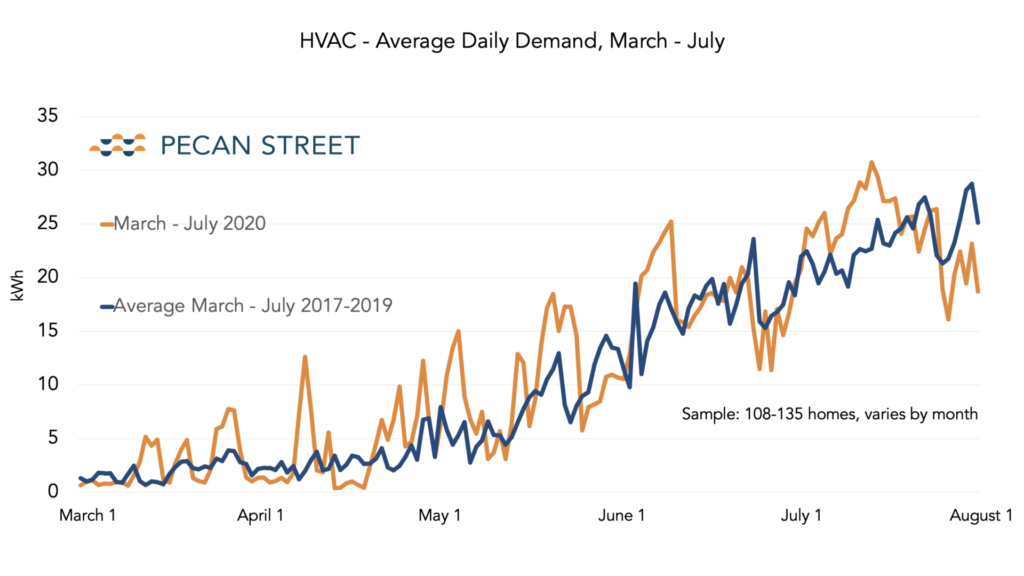
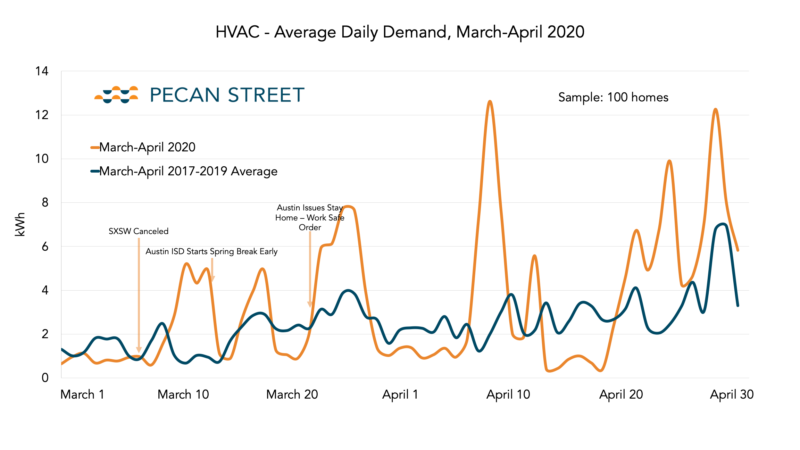
Has HVAC Usage Hit its Limit?
Austin just finished a near-record streak of 100+ degree days. And as in most southern cities, HVAC demand drives overall demand. We’ve found that this correlation is even stronger during quarantine and is responsible for the dramatic spikes in 2020 compared to previous years. These spikes are certainly related to the air temperature, but as we found before, we’re still using more AC even when you normalize for weather conditions.
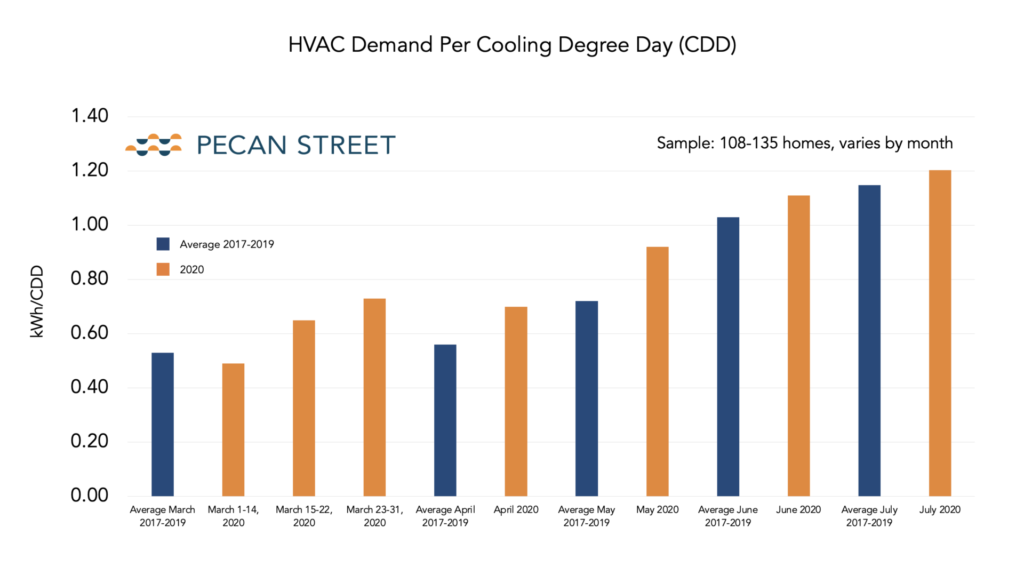
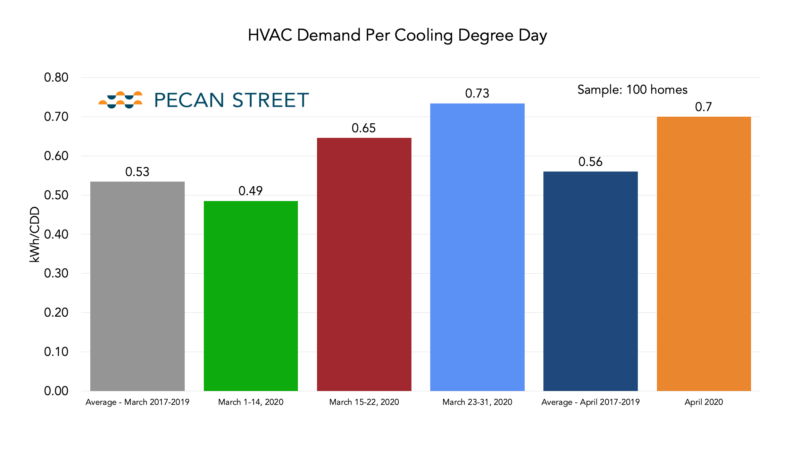
To account for the impact of weather, we used cooling degree days to standardize how many days “should have” required AC and determined how much electricity was used for each of those “cooling days.” As we saw this spring, HVAC demand per cooling degree day trend continues to exceed demand from previous years. In other words, people are using MORE energy to cool their homes than you’d expect them to for any given “warm” day. However, as we’ve moved into the hottest months of the year, the gap between 2020 and previous years has tightened – there’s a limit to how much you can run your AC. If you were already running your AC at close to capacity in previous years, there’s not much room for an increase, even if you’re home more.
Overall, it appears that the increase in residential energy use has been managed by the transmission system, with the reductions in commercial and industrial use offsetting the increase. However, this new residential demand curve certainly has impacts on consumers’ bills, the distribution system, and renewable integration.
Read on to learn more about our previous analysis from May 15 and April 6.
May 15, 2020 Analysis
Read about our COVID energy analysis at Greentech Media, T&D World and Renewable Energy World.
Or watch our May 15 webinar on Youtube. You can also view and download the webinar slides here.
As the patterns of our lives shift in response to COVID-19, our energy profiles are shifting, too. Overall, electricity demand has decreased and is expected to remain lower as commercial buildings, factories and other large electricity users slow or stop operations.
Residential use, on the other hand, is expected to rise as we shelter in place. On March 12, Bloomberg claimed “Every day’s a weekend.” But it’s a weekend day when people stay inside Zooming, streaming and gaming.
Pecan Street has been monitoring electricity use and generation from hundreds of homes in our research network for nearly a decade. Many of these homes have rooftop solar and electric vehicles, and we’ve been measuring each home’s total energy use as well as use from individual circuits, like heating/cooling, EV charging, refrigerator, etc. So we decided to take a look at how our participants’ energy profile has changed since COVID-19 sent everyone home.
The charts here include energy data from homes in our research network. All of the homes are located in a neighborhood in Austin, TX. Depending on the chart, up to 74 of the homes have rooftop solar and up to 50 of them have Level 2 electric vehicle chargers. We selected homes for which we have data from at least three previous years, so we can see how trends differ given the range of weather patterns we experience in Texas in the Spring.
Posted first (below) are our most recent charts, released on May 15, that include data from March and April.
Below our May 15 charts are the original charts we posted in April. Those include data from most of March 2020.
Check back here frequently for additional snapshots and analysis — we’ll be adding new charts as we complete them.
And be sure to review the methodology and other notes at the end of this post.
Here’s what we found.
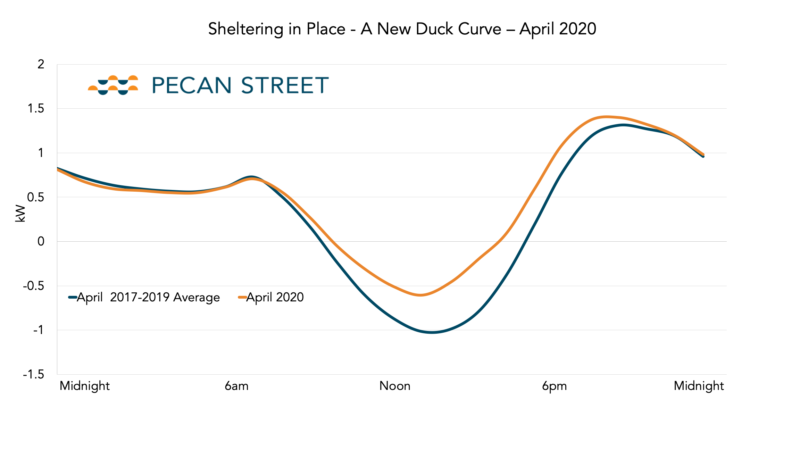
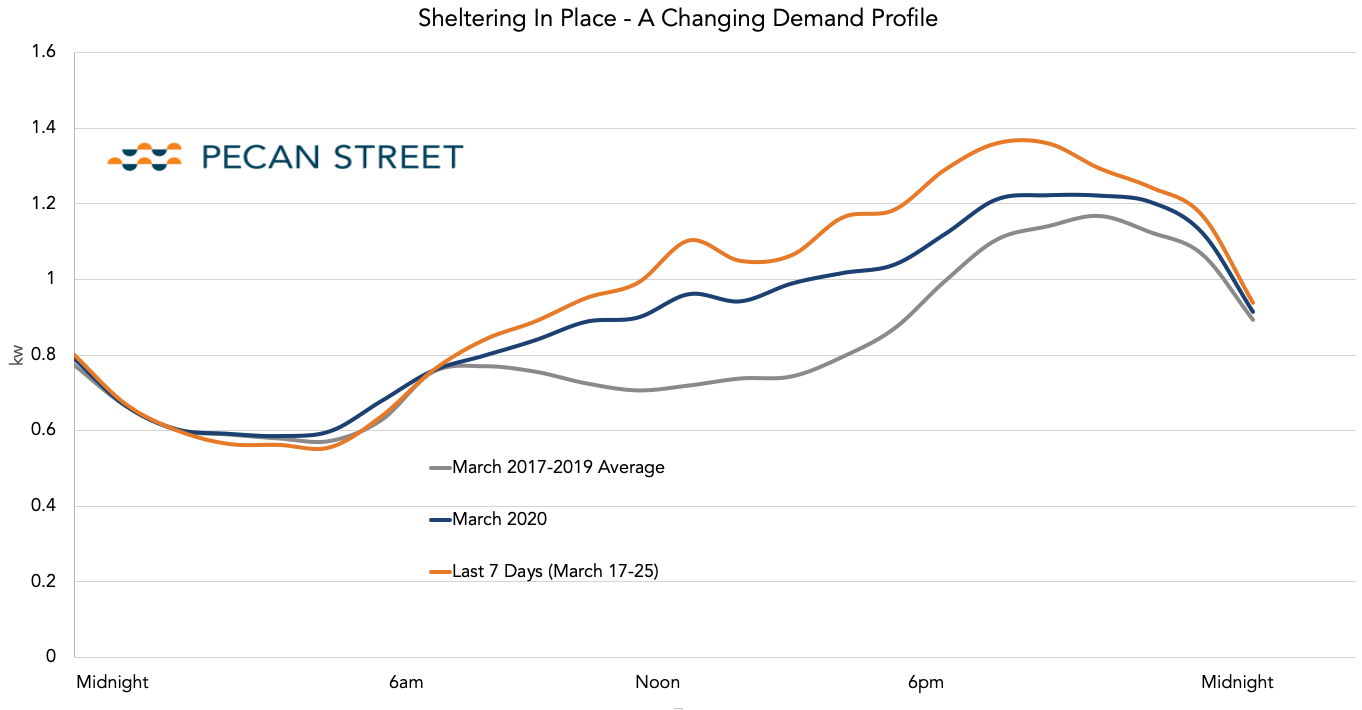
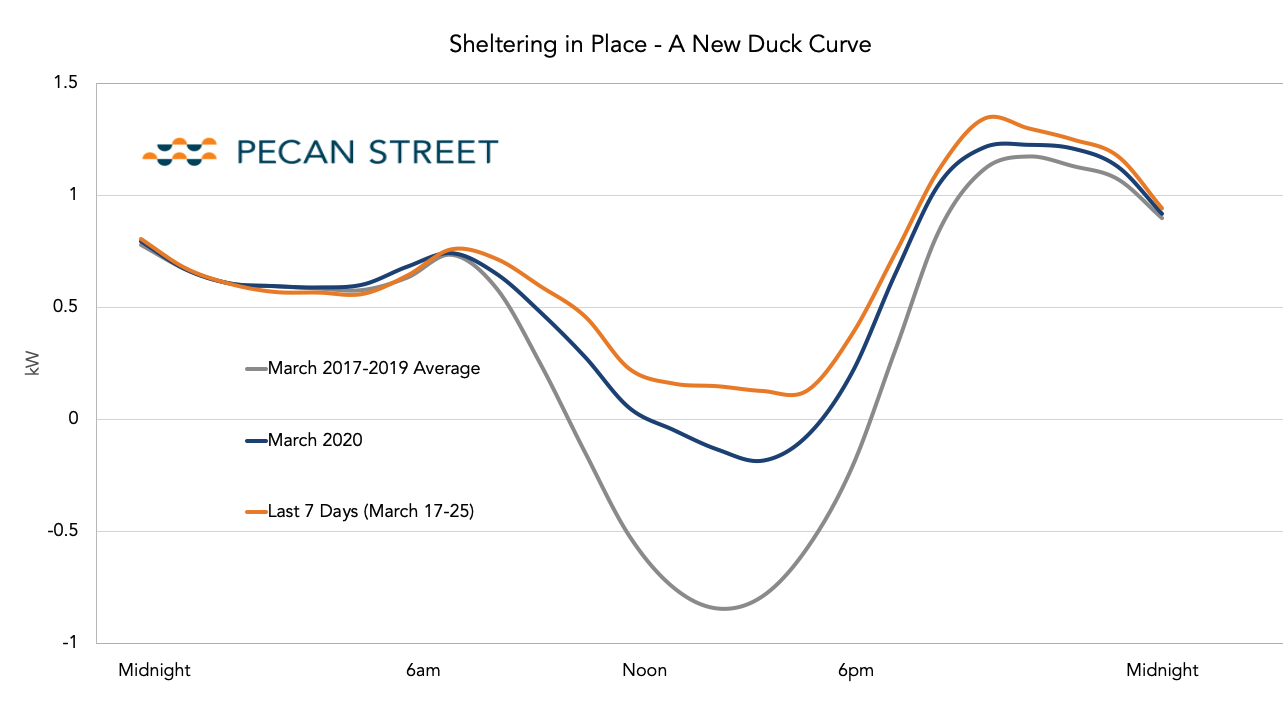
COVID-19 is changing the duck curve
In March we saw significant changes to the duck curve for the homes in our sample. March in Austin is typically a time of high rooftop solar production and relatively low energy use, but this year has been quite a divergence from the norm. Our analysis showed a reduction in “sell back” energy exports due to excess usage in homes during the day. This graph illustrates the changing duck curve over the course of the month as we transitioned from business as usual to sheltering in place.
Our new April analysis shows that the trend towards this new duck curve is holding true. Our analysis leaves us asking what can homeowners and grid operators expect as we move into a summer with higher energy use and flattening solar production?
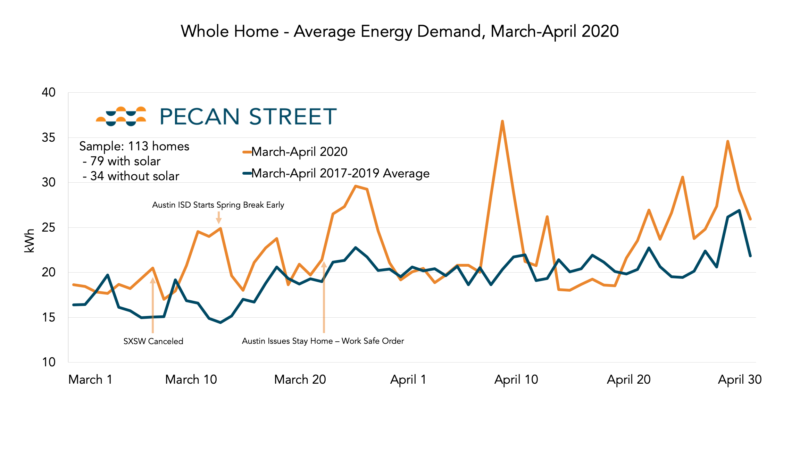
Total Residential Demand Is Up
Whole home average energy use has been consistently higher than normal throughout sheltering in place. For April, daily residential demand was about 17% higher than the average from previous Aprils. Some of the spikes are hard to interpret without looking at the components (we’ll do that in a later chart). We also see a strong correlation between energy use and weather and that correlation is exacerbated by more people being at home during the warmest part of the day. We’ll discuss this in more detail in our HVAC analysis.
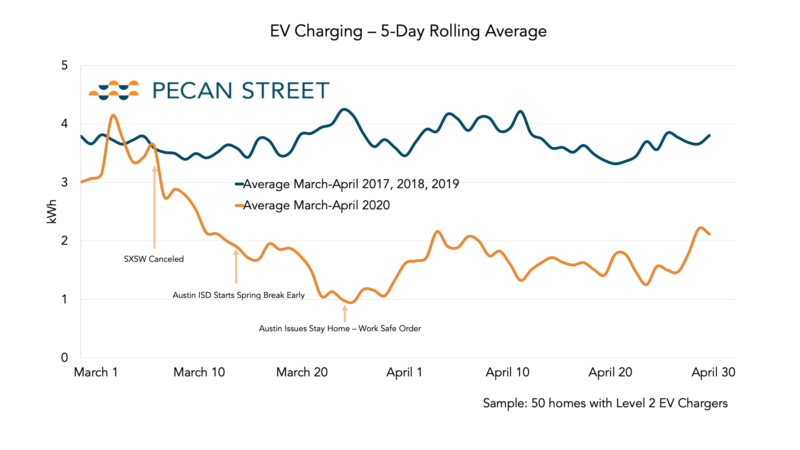
EV Chargers are getting a rest
One of the most drastic changes we observed was the reduction in EV charging. This chart shows the steep decrease in average EV charging as we transitioned into sheltering in place and a sustained reduction in demand for charging throughout April compared to the average of previous years. For this analysis we compared the 5-day rolling averages from March-April 2020 to previous years to account for any variations due to differing charging behaviors on different days of the week.
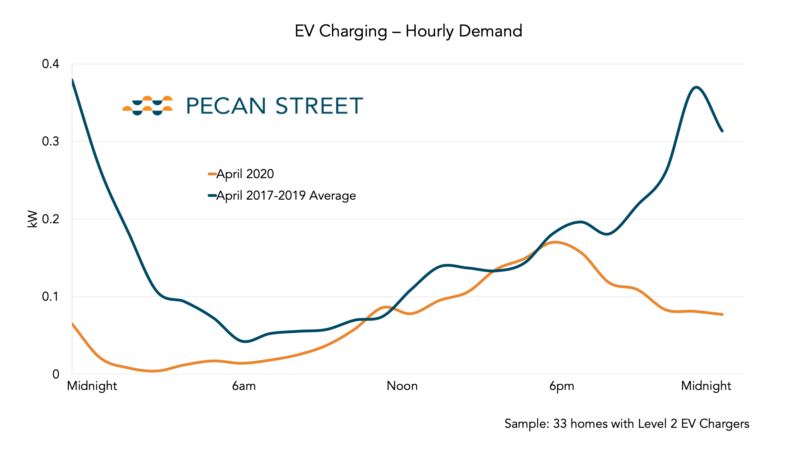
We also see a substantial shift in the times of day that EV owners charge at home. Afternoon charging has stayed relatively similar to business as usual, but in contrast, nighttime charging has decreased drastically. This points to the changing driving behavior due to the effective end of the work commute, and also that people are taking shorter trips that require less time to recharge.
Accessory Use is Up
EVs and air conditioners are significant loads. But there are a lot of other electricity uses inside the home, and since Austinites began saying home, they’ve been using a lot more energy. Compare the “business as usual” trend lines from March 2017-2019 (gray) and April 2017-2019 dark blue) to the last week of March 2020 (light blue) and all of April 2020 (orange).
HVAC – Families are keeping their cool. Literally.
Air conditioning is a huge driver of total demand in Austin, and the HVAC Average daily demand data shows that as goes the AC, so goes total demand. That is as true during a shutdown as ever. We also see a lot of dramatic spikes for March-April 2020, which is certainly related to weather. But not completely…
To account for the impact of weather (temperature, really), we used cooling degree days to standardize how many days “should have” required AC and then determining how much electricity was used for each of those “cooling days.” We found that the HVAC demand per cooling degree day trend we saw in March continued through April. In other words, people are using MORE energy to cool their homes than you’d expect them to for any given “warm” day.
April 6, 2020 Analysis
Total Residential Demand Is Up
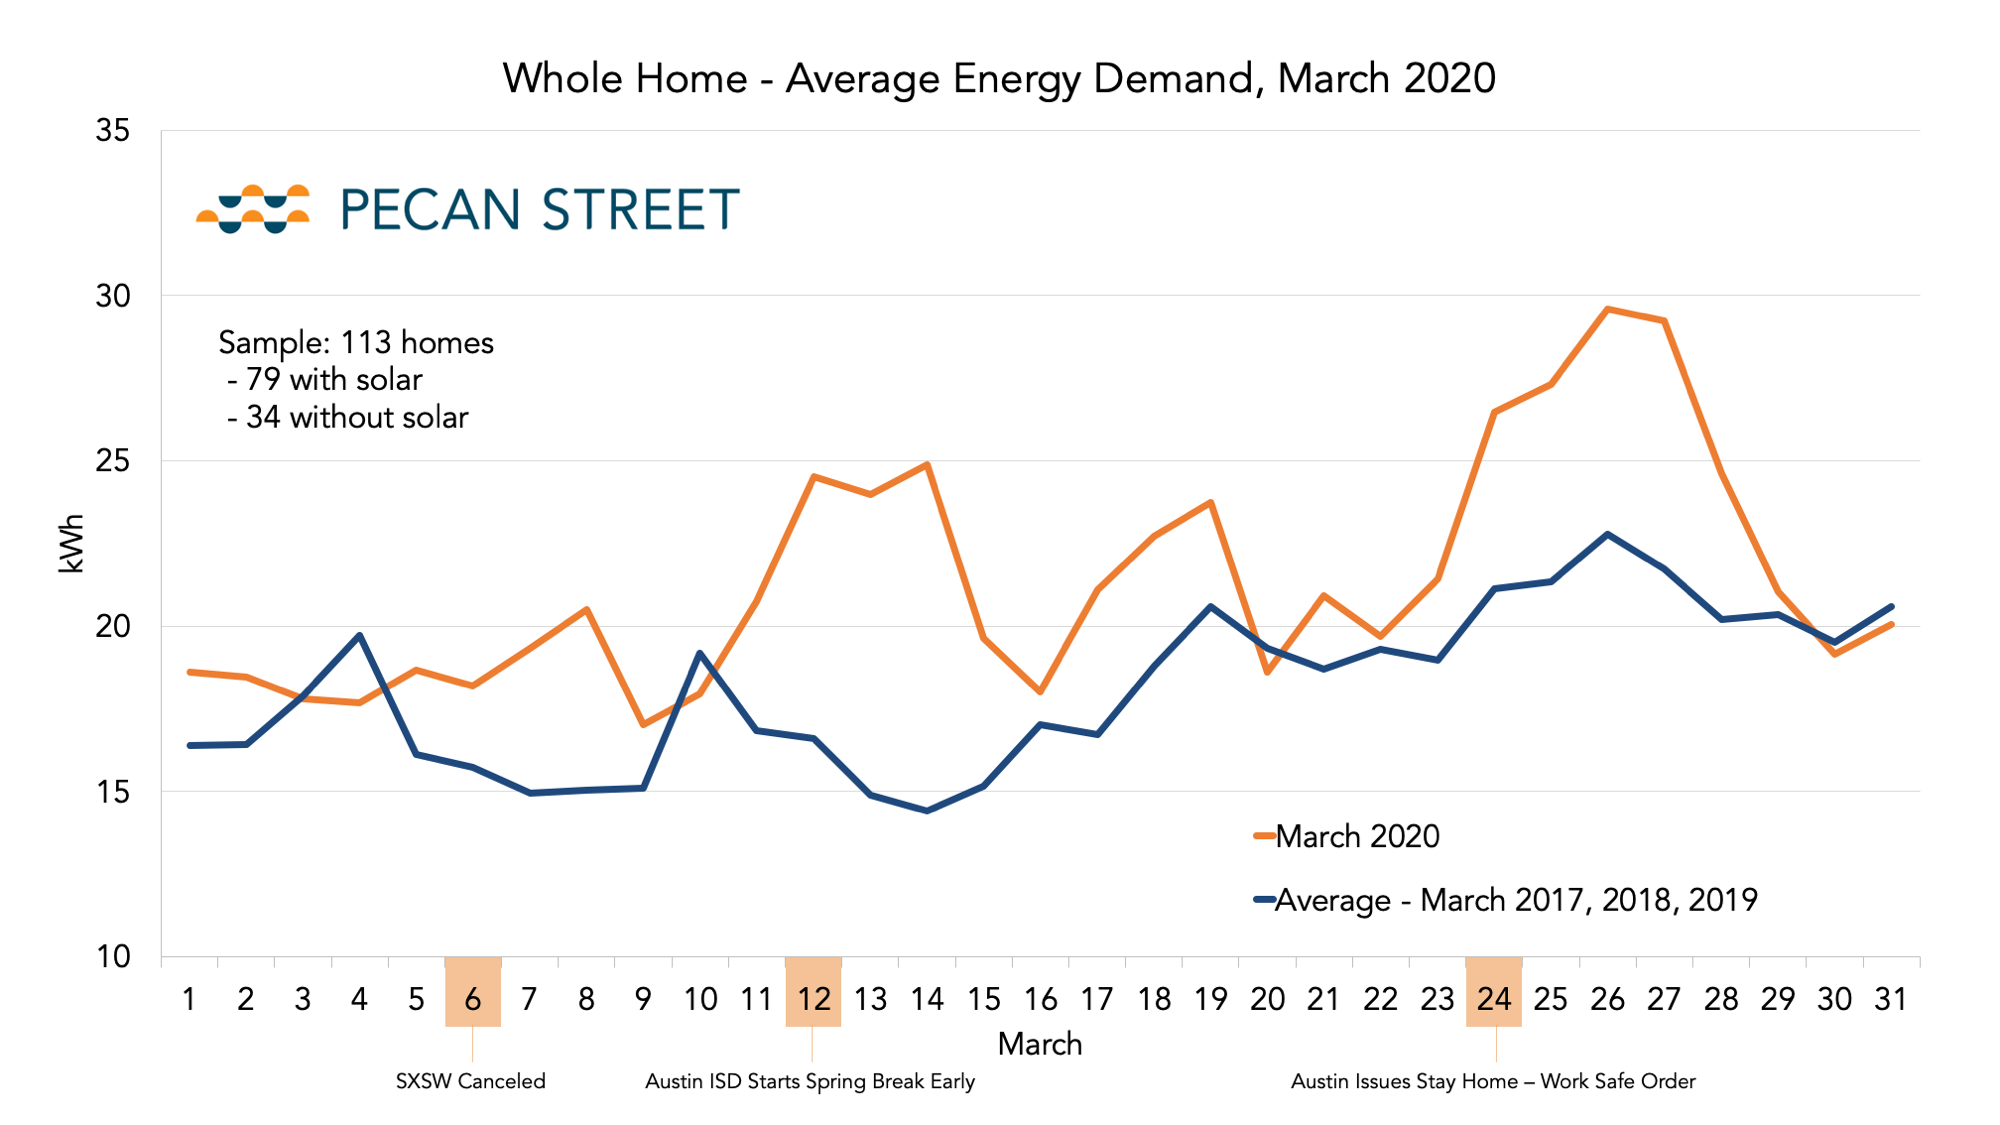
Our first snapshot was conducted on March 26 and includes data from March 1-25. For historic comparison, we averaged the figures from previous Marches (2017, 2018 and 2019). Daily residential demand was ~20% higher than in previous Marches.
We then examined demand over the course of the month. We had some warm spells during March (we’ll address that below), but overall, demand is up visibly compared to previous Marches, and it increased throughout the month as more announcements were made and more people stayed home.
COVID-19 is changing the duck curve
One of our network’s most unique qualities is its high penetration of rooftop solar. In Austin, March is one of the months that solar customers significantly recoup on their investment. Solar production is very high and energy use is fairly low, so they “sell” a lot of energy back to the grid. That’s not the case this March. Though individual homes experienced brief periods of negative demand and sent power back to the grid, on average, the curve of our blended homes shifted upward with less of that energy going back to the grid. The solar homes in the analysis are using every kW of electricity they produce during the day. This snapshot includes data from March 1-25.
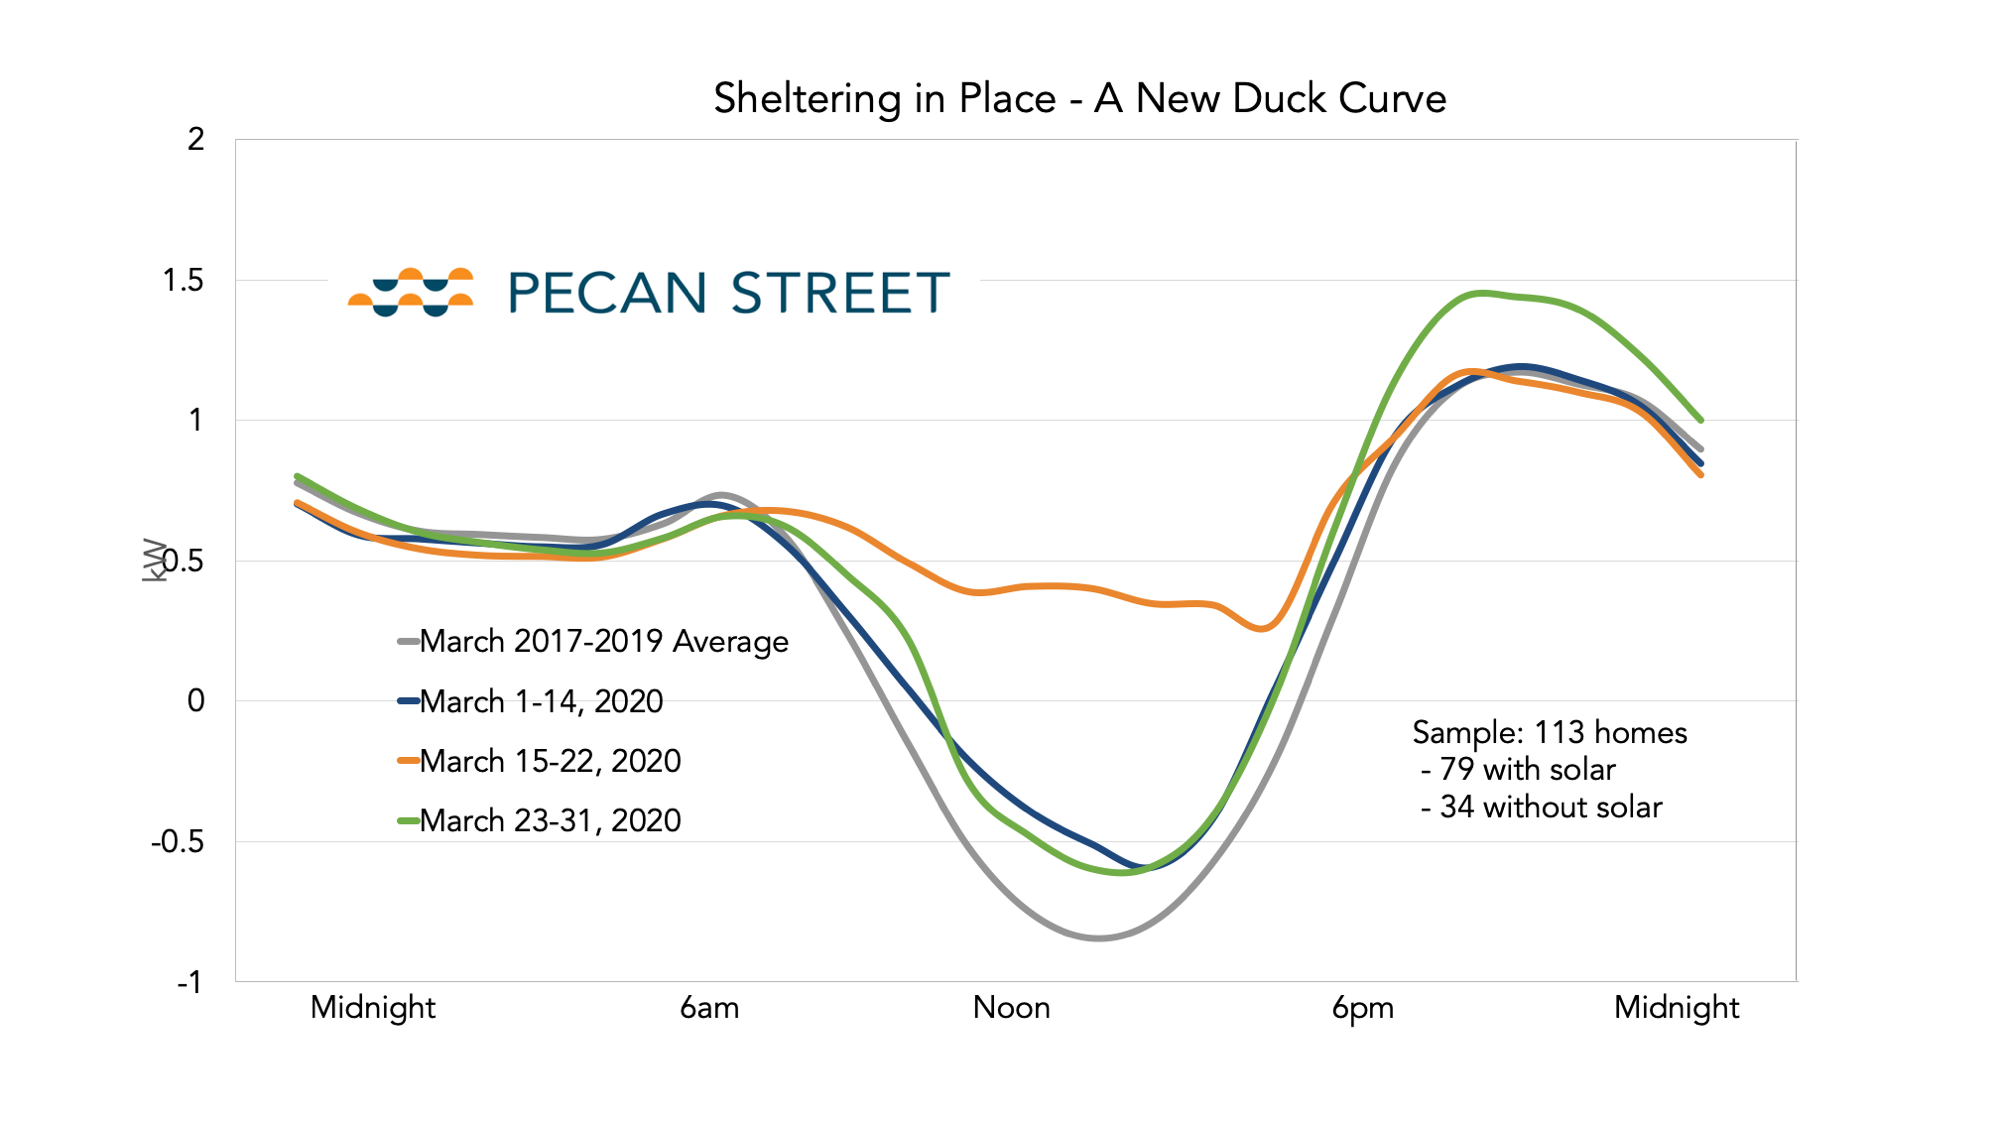
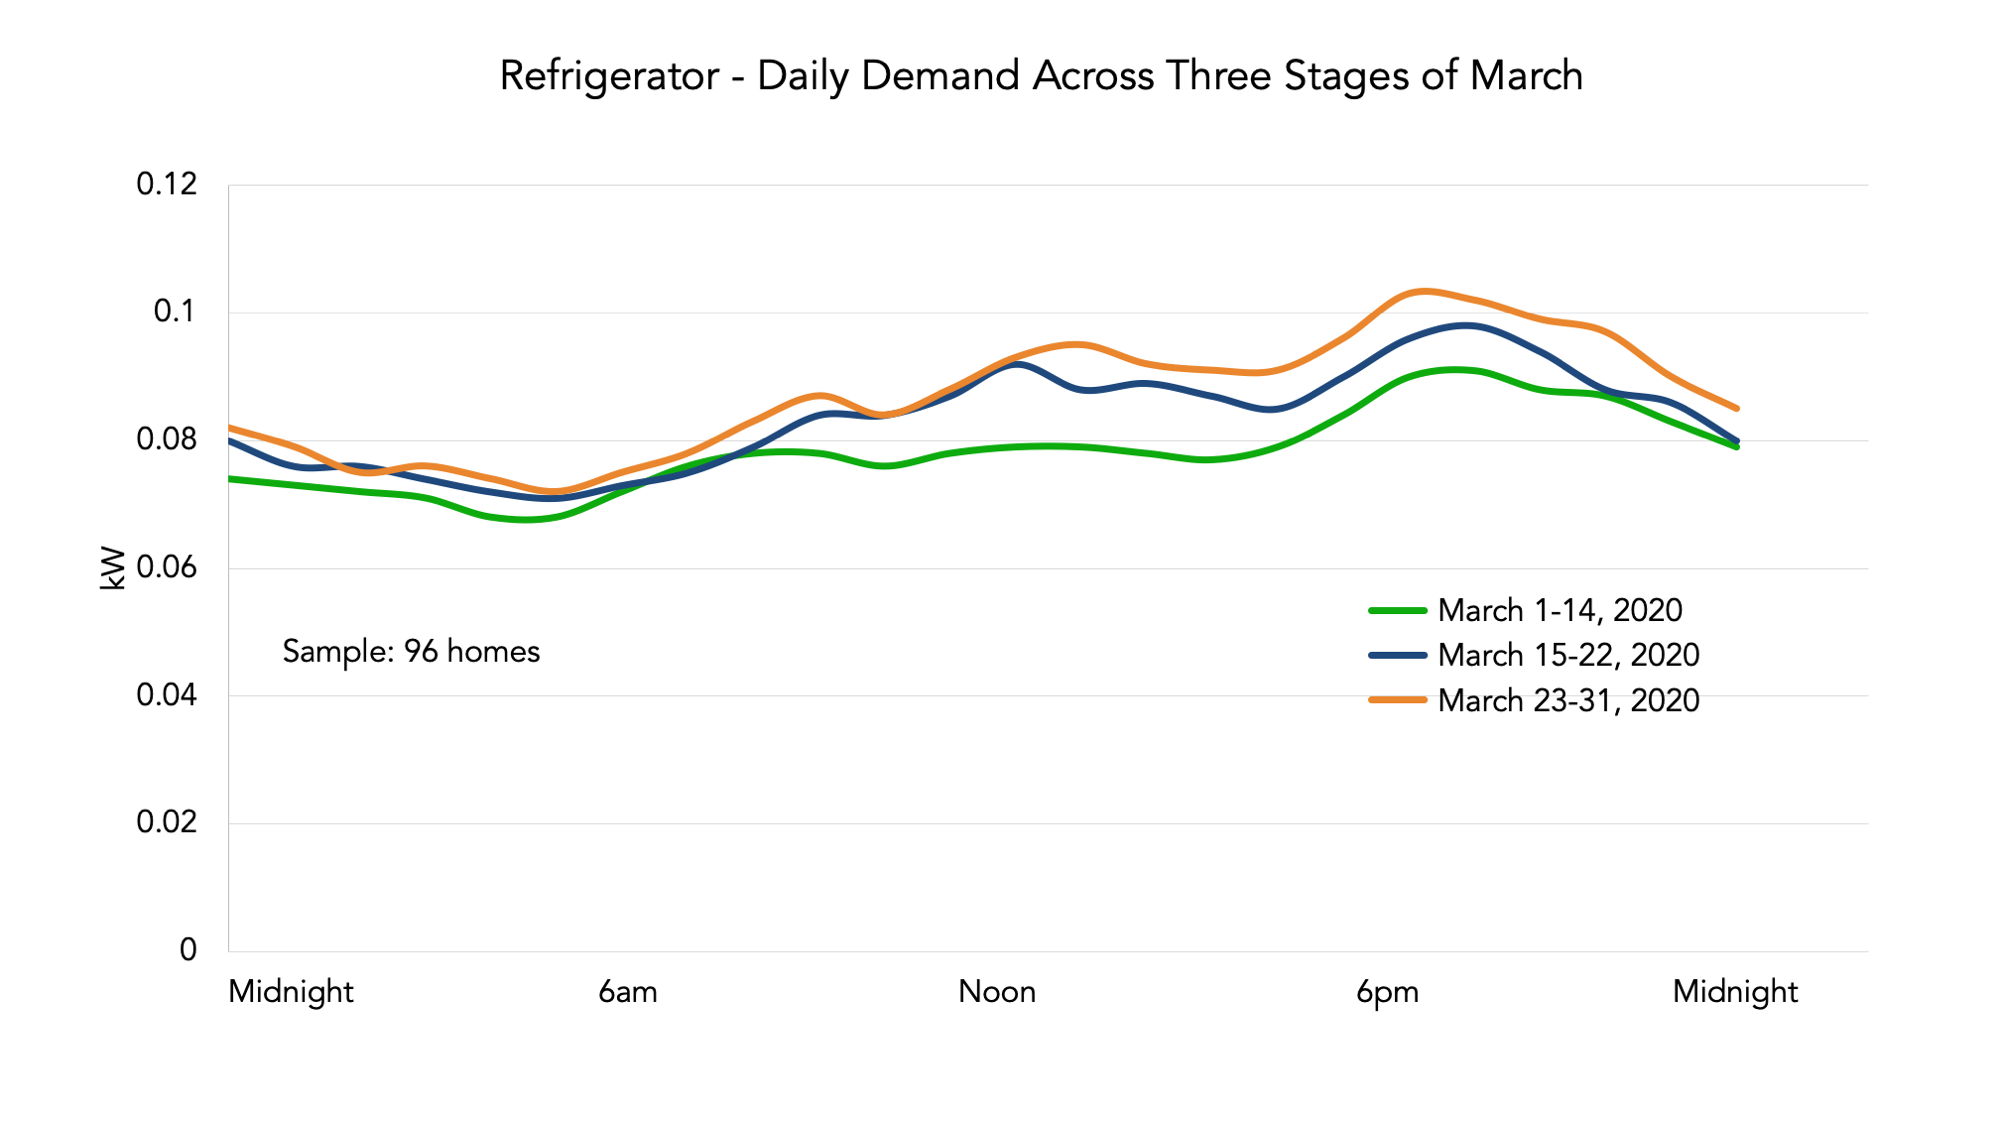
When March ended, we reran the analysis and broke the month into so-called “phases of shutdown” in Austin — March 1-14, when things were just starting to change, March 15-22, and March 23-31, which captures the city’s official Stay Home – Work Safe order.
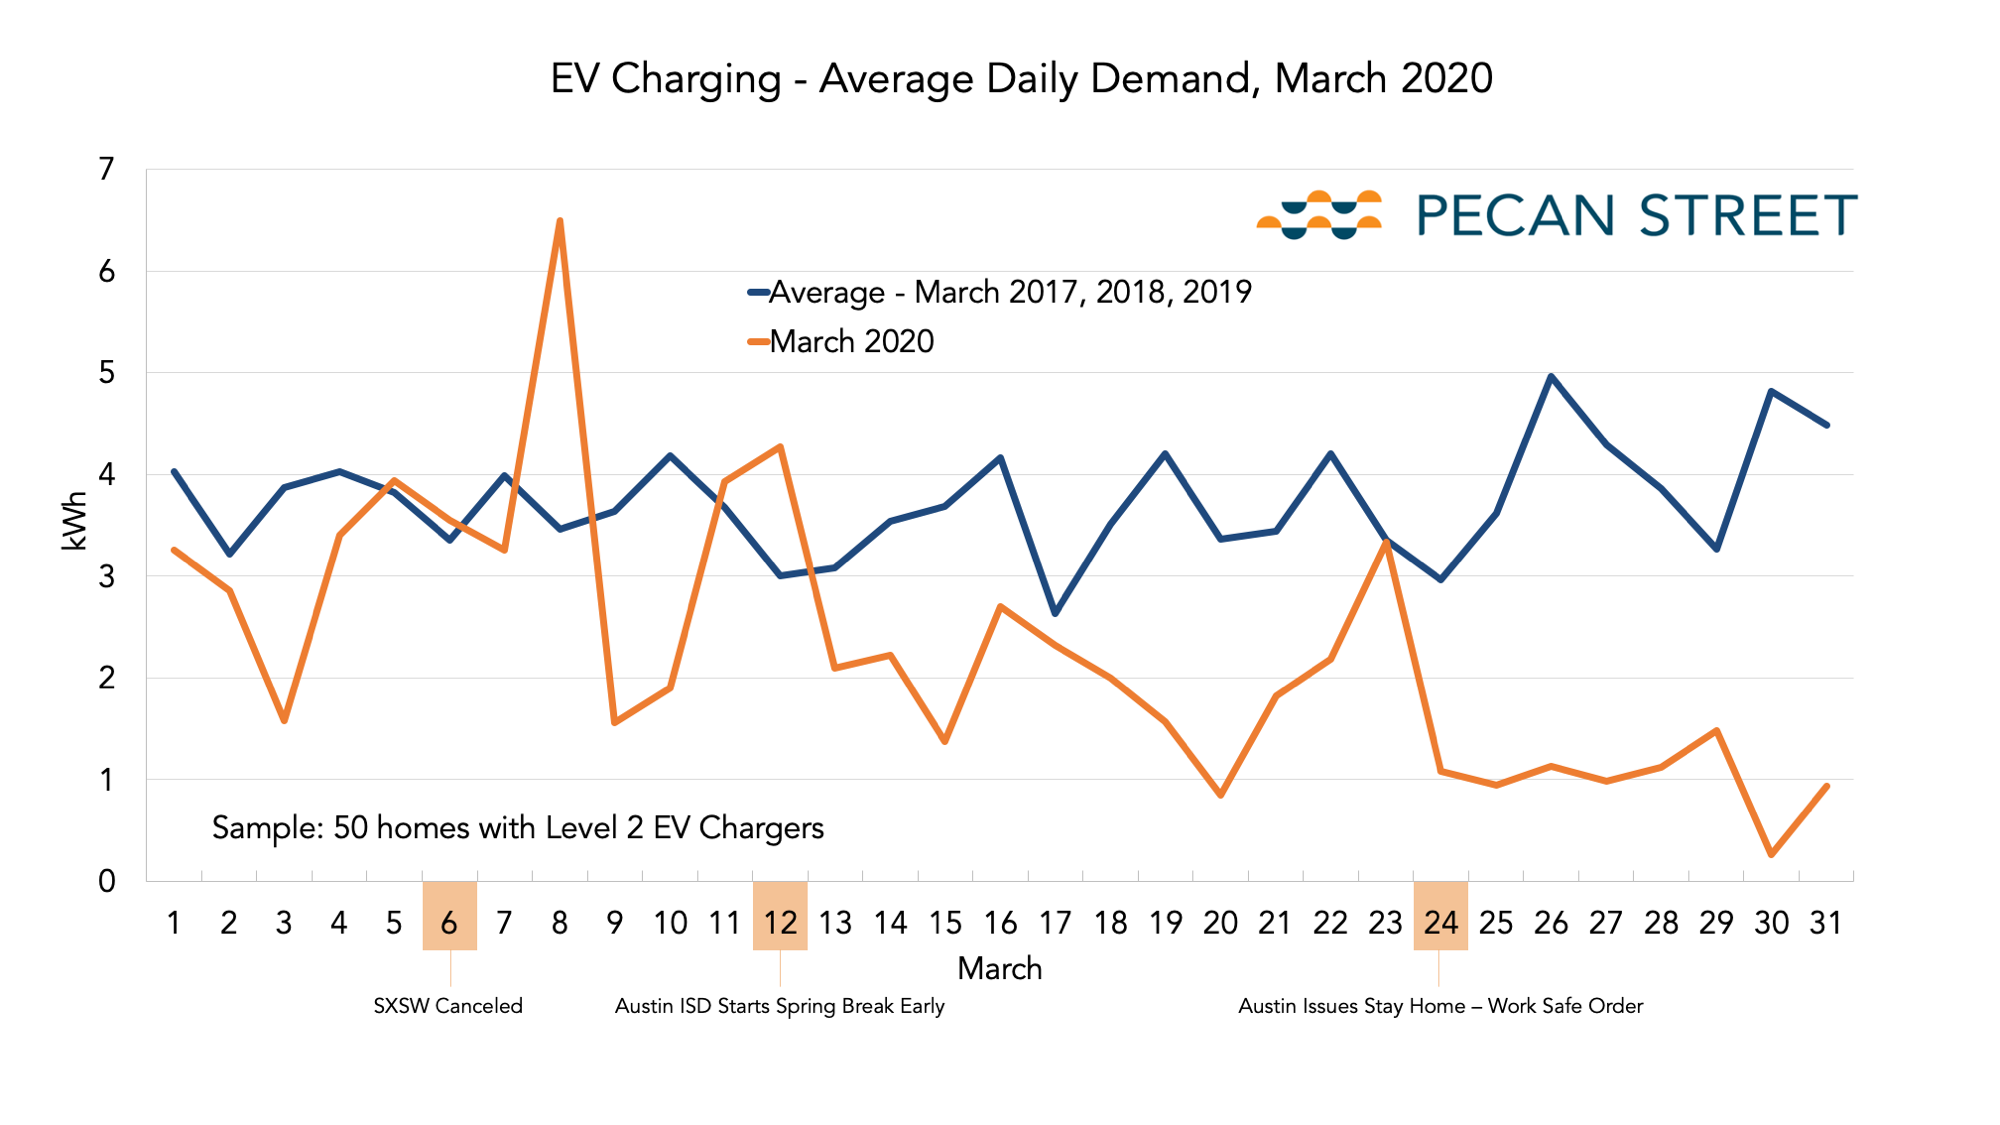
EV Chargers are getting a rest
Not surprisingly, demand for EV charging is way down since Austinites started staying home. Demand dropped considerably once Austin ISD closed early for Spring Break (March 12) and Mayor Adler signed the Stay Home – Work Safe order (March 24).
Refrigerators are working overtime
If you think you’re spending a lot of time in front of an open refrigerator, you’re probably right. Today’s refrigerators are much more efficient than older models, and the homes in our research network have newer-than-average models. Even so, demand is up considerably. Frequent opening and closing isn’t the only possible culprit, however. Families are likely storing leftovers more than usual; putting warm leftovers in the fridge kicks the appliance into overdrive.
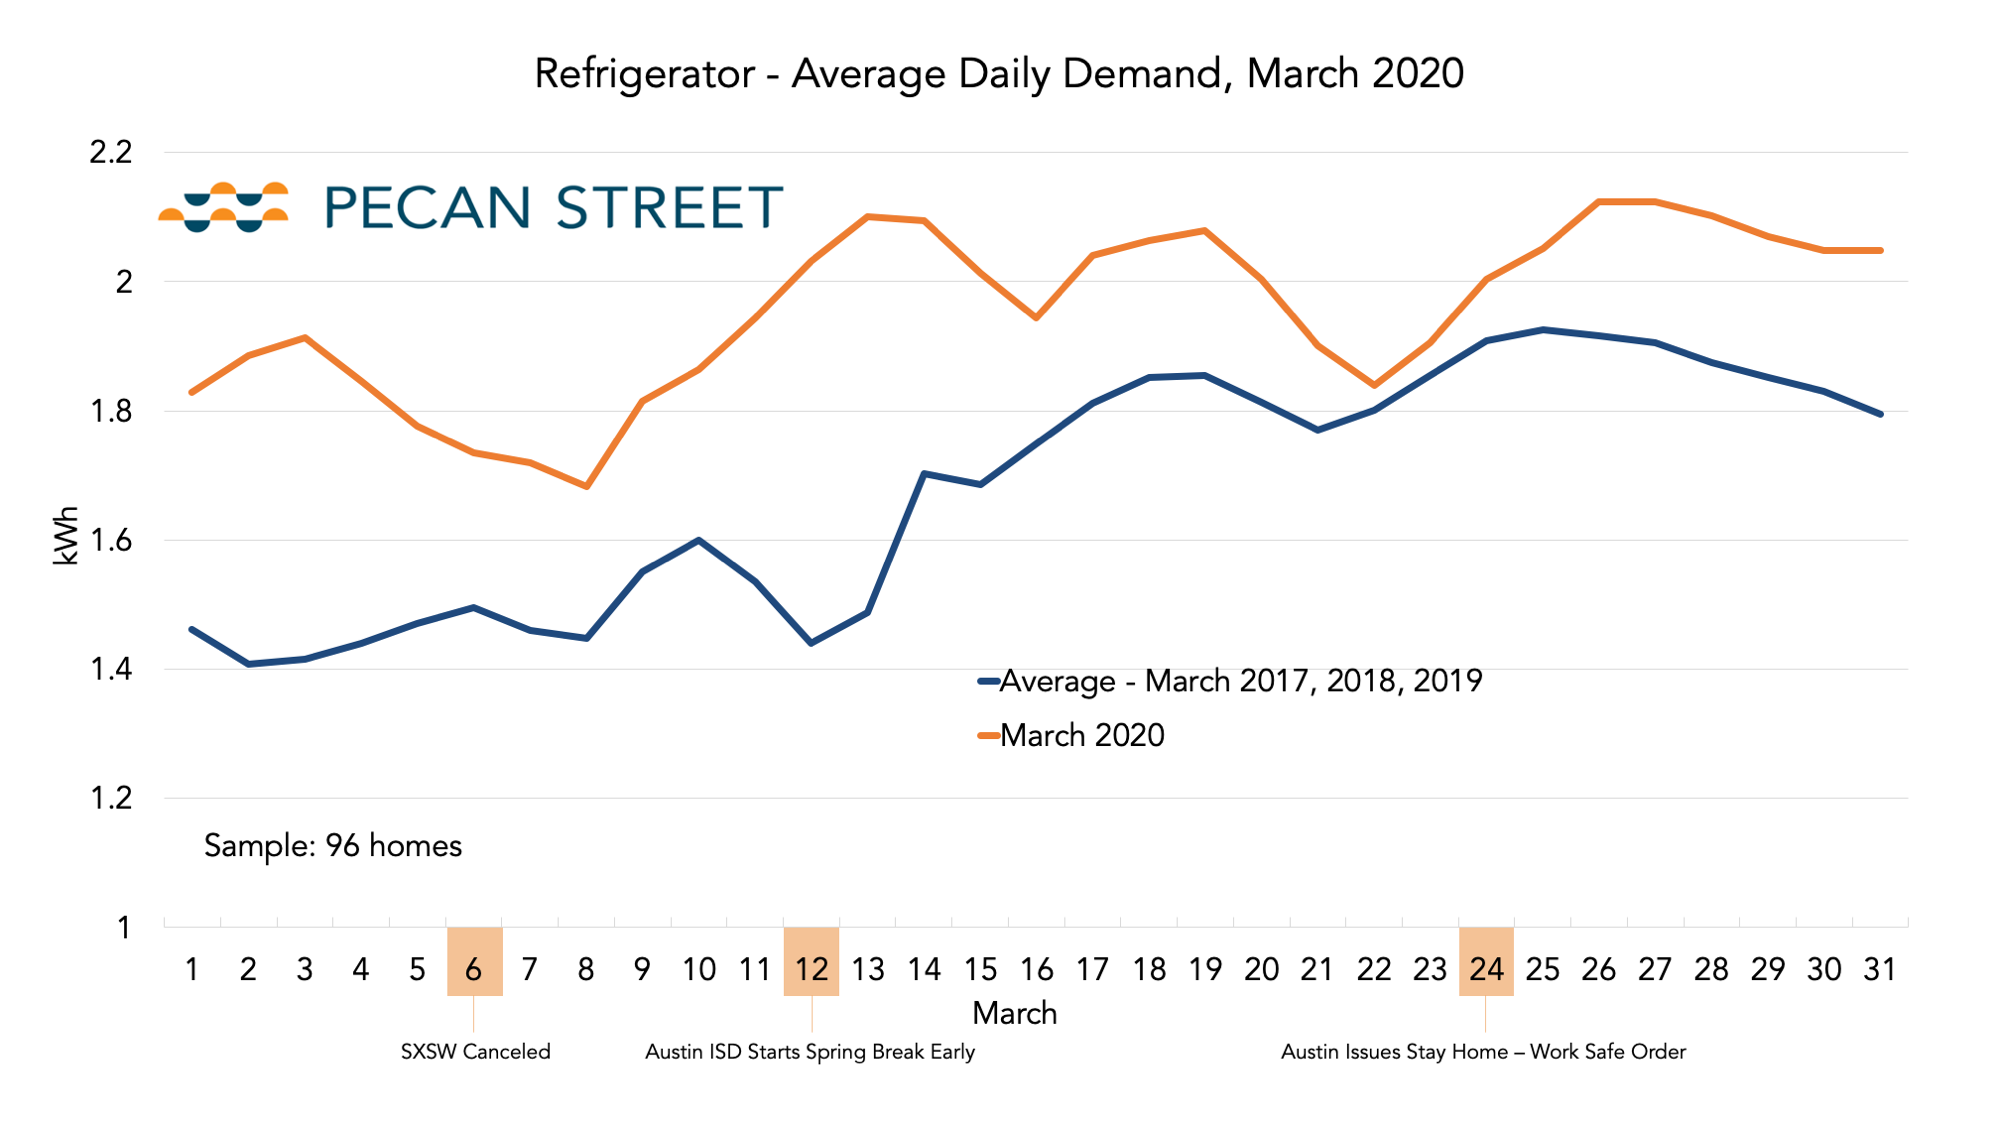
In addition to historical comparisons, we examined refrigerator use through Austin’s “stages of shutdown.” Compared to the first two weeks of the month, refrigerator demand is up considerably.
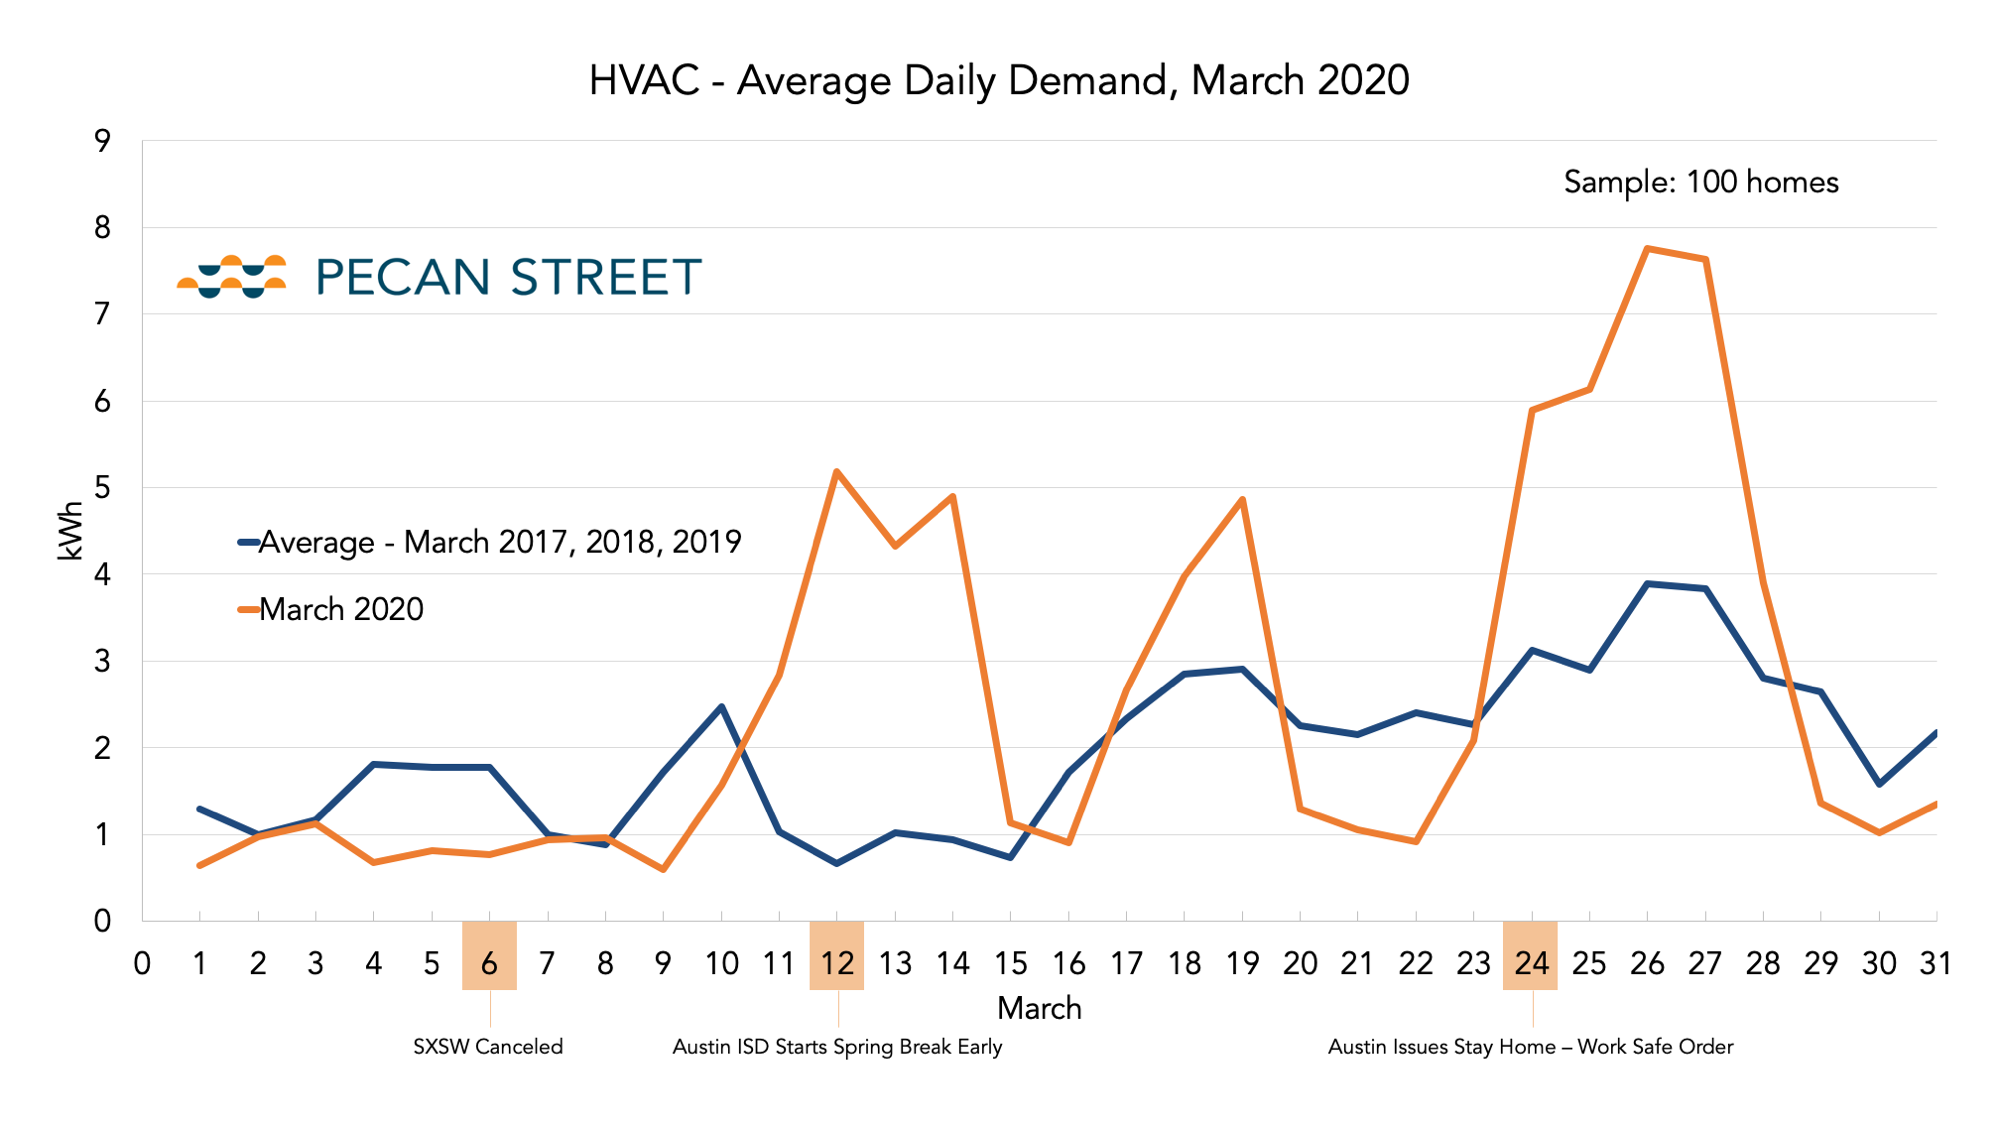
HVAC – Families are keeping their cool. Literally.
Energy demand in Austin is heavily influenced by air conditioning, and not just during our brutal summers. Even in March, temperature swings can produce significant spikes in energy use. So, comparisons with previous Marches can be difficult. That said, here’s the daily demand from HVAC for the month.
 We used kWh of HVAC demand per Cooling Degree Days (CDD) to account for weather variances. A CDD is the number of degrees that the outside temperature averages over a target temperature for a day. The more Cooling Degree Days, the more likely someone is to run their air conditioner. We used the fairly standard 65 degrees for our calculations. Even after accounting for weather swings, residents are using about 40% more electricity to cool their homes.
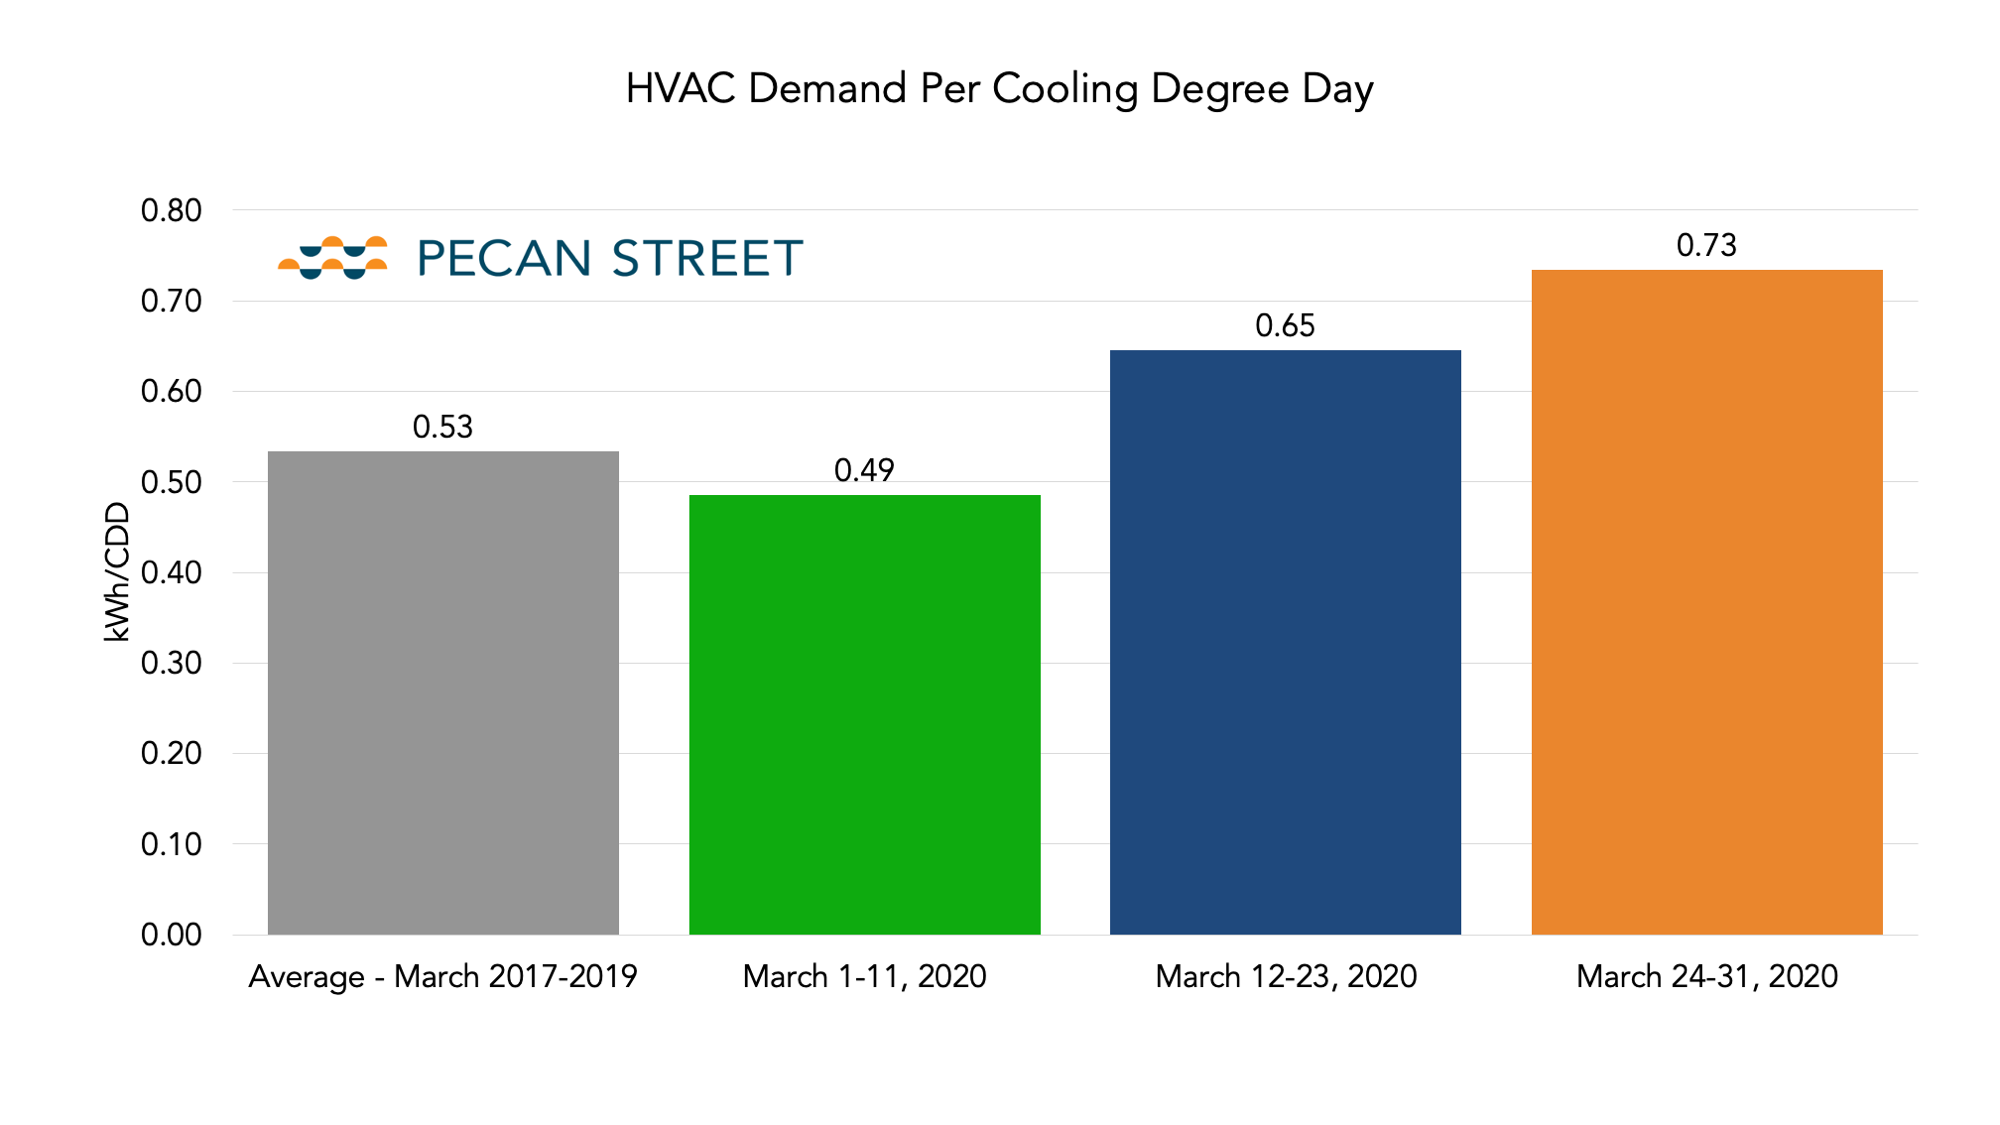
So, residents were asking their HVACs to work more than you’d expect them to based on kWh per CDD. They’re home more and more people are likely adjusting the thermostat. The AC simply isn’t getting the breaks it usually does.
Methodology and other details below…..and more charts to come. Check back soon.
Methodology Details
- We examined a subset of our participants that have been part of our network for several years and favored homes with rooftop solar and EVs so we could capture how those technologies contributed to any changes.
- Our calculations include a total of 113 homes. 74 of them have rooftop solar. 50 of them have Level 2 EV chargers.
- In each of these homes, our sensor equipment measures demand (and for solar, generation) as frequently as every second.
- All homes are located in one neighborhood in Austin, Texas.
- For several of the comparisons, we examined the average demand throughout the day (kW) and for each day of the month (kWh). For historic comparison, we averaged the figures from previous Marches and Aprils (2017, 2018 and 2019).
Details about March & April 2020 in Austin Texas
- All of the homes included in these analyses are part of Pecan Street’s research network and are located in Austin, Texas.
- Austin experienced one of the country’s first high-profile COVID-related cancelations when SXSW was called off on March 6.
- Spring Break for many Central Texas school districts was March 16-20. Austin Independent School District canceled all classes on March 12, the last day before Spring Break, and has closed all school buildings and facilities for the remainder of the school year.
- March and April weather in Austin is extremely varied. This year included dramatic swings of cool (60s) and warm (90s) high temperatures throughout the analysis period. Pecan Street’s analysis of HVAC demand accounts for this variation.