April 6, 2023
By Rachel Jenkins, director of operations, Pecan Street
If Pecan Street has installed an eGauge in your home and you’re looking for a quick guide for viewing your data, you’re in the right place.
Below you’ll find everything you need to know to log in and nerd out.
If you’d like a video walk-through of this information, you can watch the YouTube video below. Same content, less reading.
Logging In
You’ll need three things to get started.
- A custom eGauge URL. It will look something like this: http://egauge48881.eg.pecanstreet.org/62679/classic.html
- Your username
- Your password
Pecan Street emailed these to you after we installed the equipment. If you can’t find them, email me at rjenkins@pecanstreet.org and I can look them up for you. (All of these are unique to you, and we keep them all secure.)
If you have all three, click on the egauge URL or paste it in a browser. That will bring up a sign-in window. Enter your username and password and click Sign In.
Once logged in, most of the portal screen will load immediately, but it may take your data a few seconds to load. Now, let’s look at the different parts of the screen.
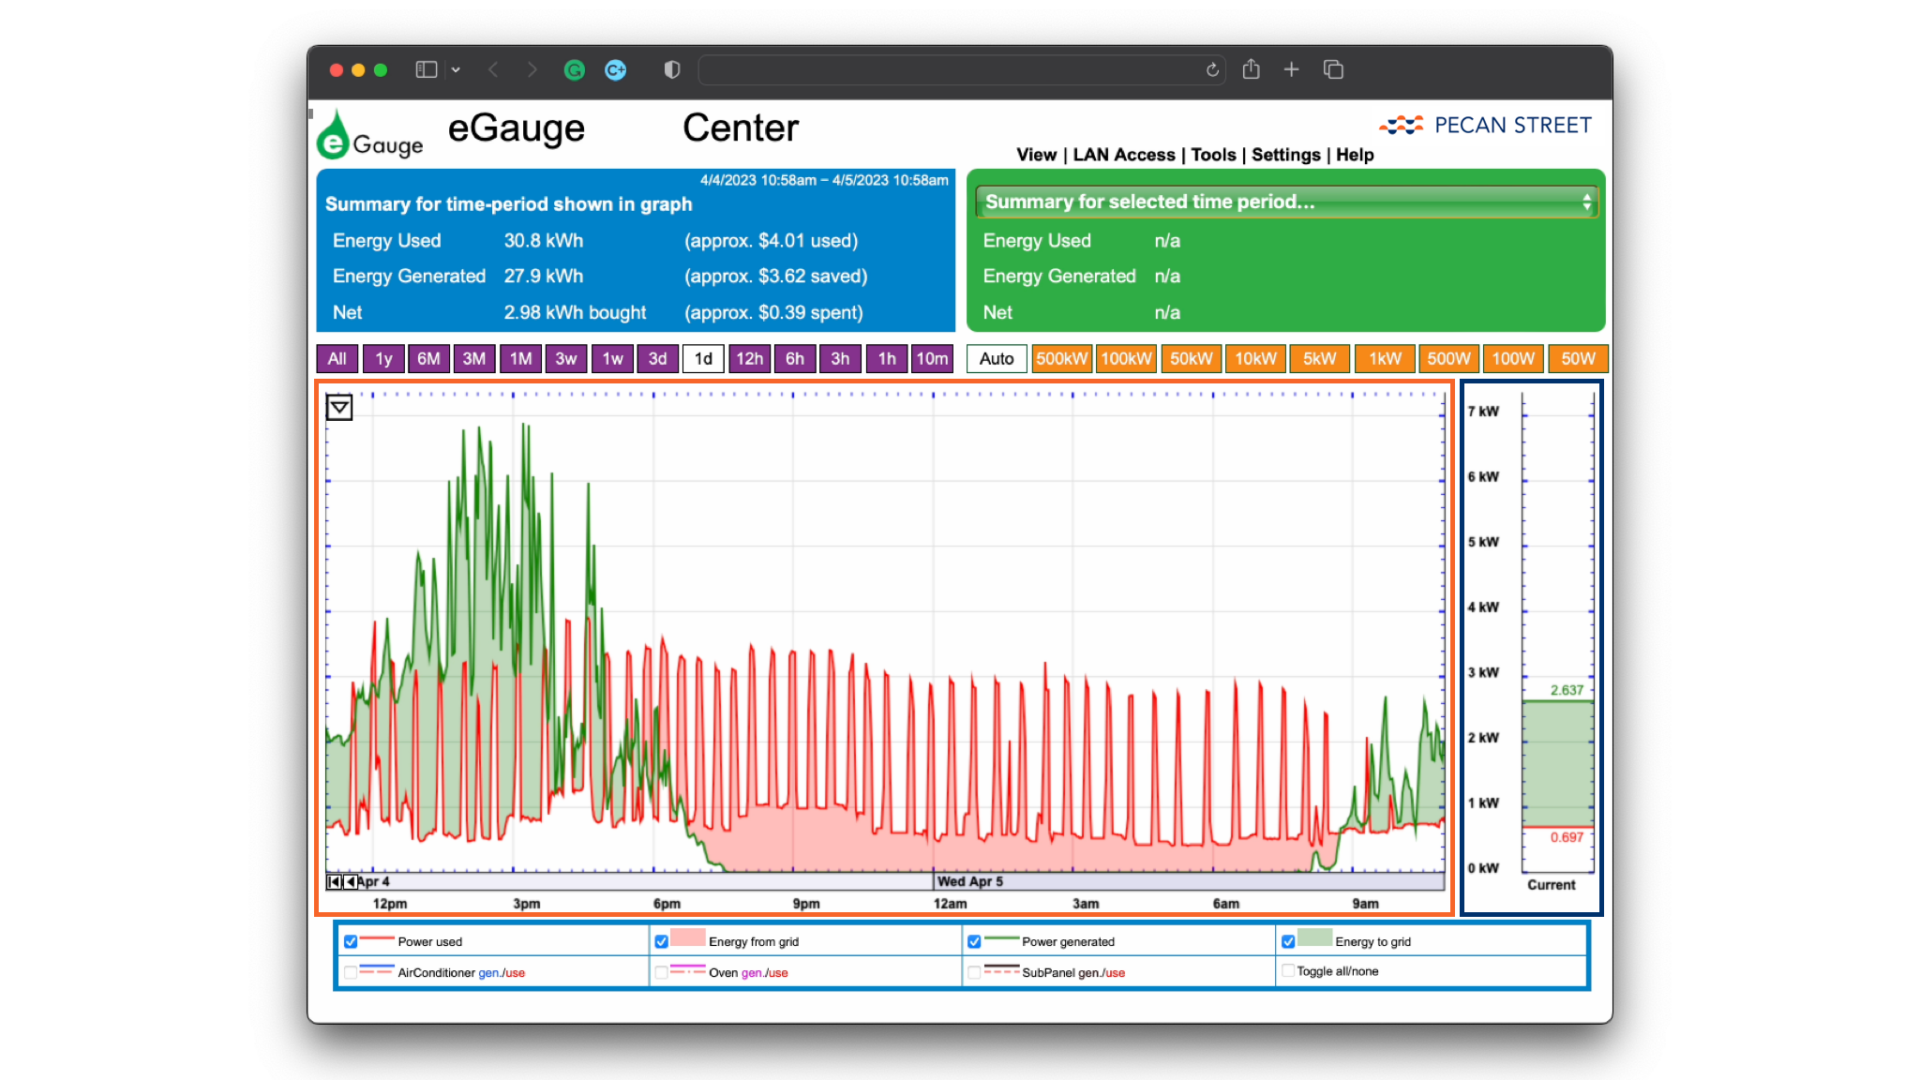
Data Visualization Section
Inside the orange box, the data visualization section is where you’ll see your energy use and, if you have solar panels connected to the system, your energy generation over time.
Above the data visualization area, you’ll see options to adjust the timeframe that will be displayed. It ranges from a very short 10-minute view to a one-year view. Even though the view can go all the way out to one year – you will only be able to see data going out one week since we are collecting data at the 1-second level.
To the right of the timeframe settings, you’ll see options for changing the units of electricity….from 50W to 500kW. We recommend keeping this on AUTO so the scale will adjust as you work.
Real-Time Gauge
Inside the blue box, the vertical gauge on the right shows the real-time energy use and generation of your entire home. As things turn on and off, you’ll see this line fluctuate up and down in real time.
If you have solar panels, the gauge will show a shaded area during times when your panels are generating more energy than your home is using. For most of our users, this shaded area estimates the amount of energy your home is sending back to the grid.
Measured Circuits Toggles
Below the data visualization area are the individual circuits you can toggle on and off. Keep in mind that each of our homes measures different circuits, so this section will look different for you. In this sample home, we are monitoring energy use and generation.
On the use side, we measure the whole home power use, and the use of the air conditioner, oven, and the sub panel inside the home. Your home may include an EV charger, refrigerator or other specific energy uses.
For generation, we can see how much power was generated by the solar panels. And then we can compare the energy used and generated to calculate how much energy is being pulled from the grid or, when solar generation is greater than use, how much energy is being sent back to the grid.
The blue and green sections above the data visualization area provide quick estimates for total energy used and generated and the net – which will show as bought or sold. Note that dollar amounts here are estimates only, based on utility rates you may have shared with our team.
And that’s it! If you have any questions, please email me and I’ll help you troubleshoot any problems. If you cannot access your eGauge because it is offline, check out our video on how to troubleshoot your system.