February 24, 2022
By Scott Hinson, chief technology officer, Pecan Street
Texans sighed in relief following the recent cold snap. And though we fared much better than we did during Winter Storm Uri in February 2021, grid experts were quick to caution anyone – especially politicians who claimed that “everything that needed to be done was done to fix the power grid in Texas” – this month’s freeze was not a true test of our resilience against another Uri-calibur threat.
A few key differences between Freeze 2021 and Freeze 2022:
- The event was much shorter this year. In 2021, for example, Uri kept Austin below freezing for 144 straight hours. This month’s weather event was much shorter.
- Unlike last year, Texas entered this month’s weather event with a massive electricity reserve margin. I pointed out the huge reserve margin on February 3, 2022 – 9,304 MW. Our friend Josh Rhodes pointed out that’s about 5 or 6 Austins worth of electricity.
- Moreover, this month’s freeze was preceded by a week of mild weather, which warmed up the infrastructure and provided a period of thermal protection from the cold. The week before Uri was frigid if not freezing.
All that said…the recent freeze DID give us an opportunity to compare electricity use in our research network before and during the event to how people used power during last year’s crisis. Did they learn any tips or tricks? Did they panic heat their homes to prepare for power outages? Did they charge their cars any differently?
Here’s what we saw.
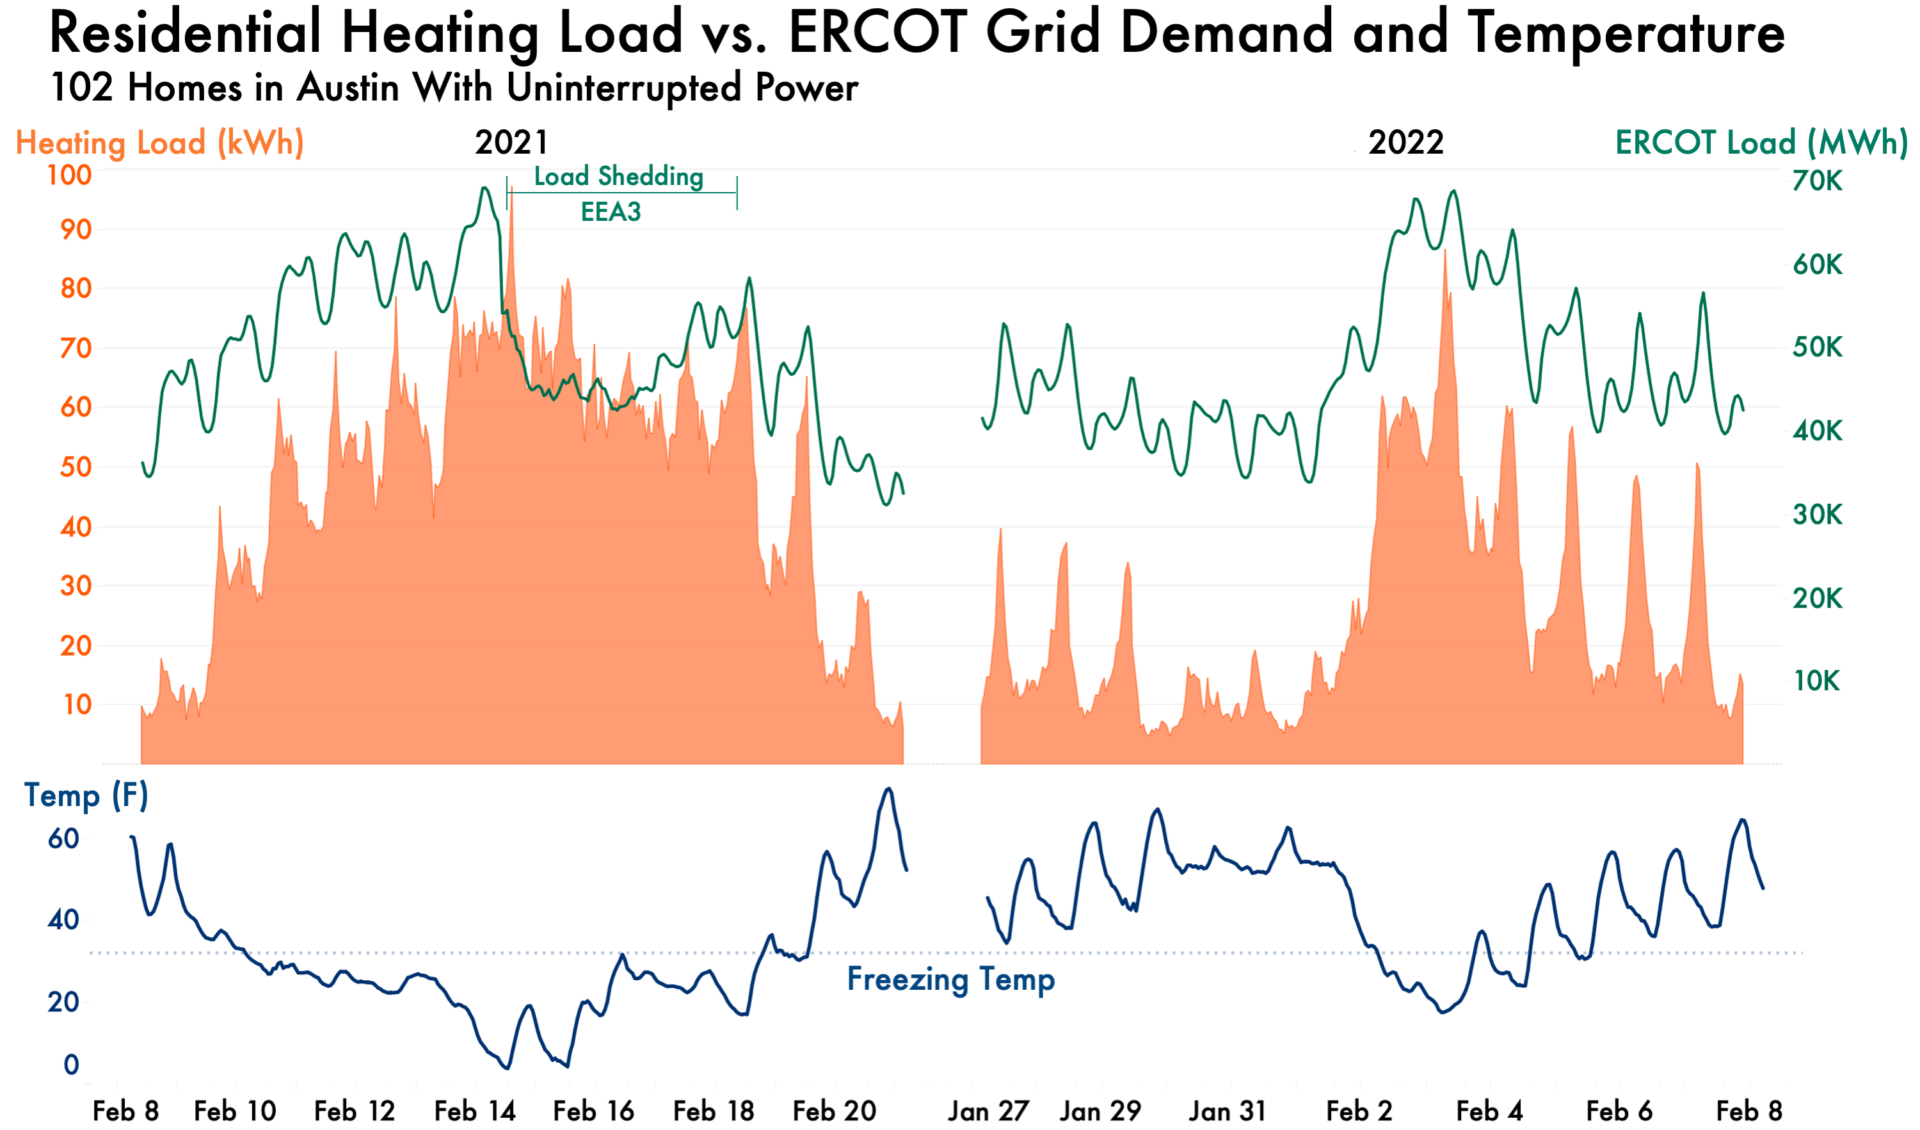 Figure A – Residential Heating Load vs ERCOT Grid Demand
Figure A shows the heating load from the same homes in our testbed during both storms. In both events, the heating load mirrored the overall demand of the ERCOT grid, with a daily peak from 6 – 8 am. Notice how strong the correlation is between building heating load and grid demand when temperatures reach extreme lows. In other words, making homes more efficient and responsive will have the most dramatic impact on extreme weather grid peaks. This includes replacing resistance heaters with heat pumps, installing more smart thermostats, increasing home weatherization, amping up demand response programs for space and water heaters, and installing more heat pump water heaters. In most cases, efficiency improvements we make to reduce cold weather peaks will help reduce hot weather peaks, too.
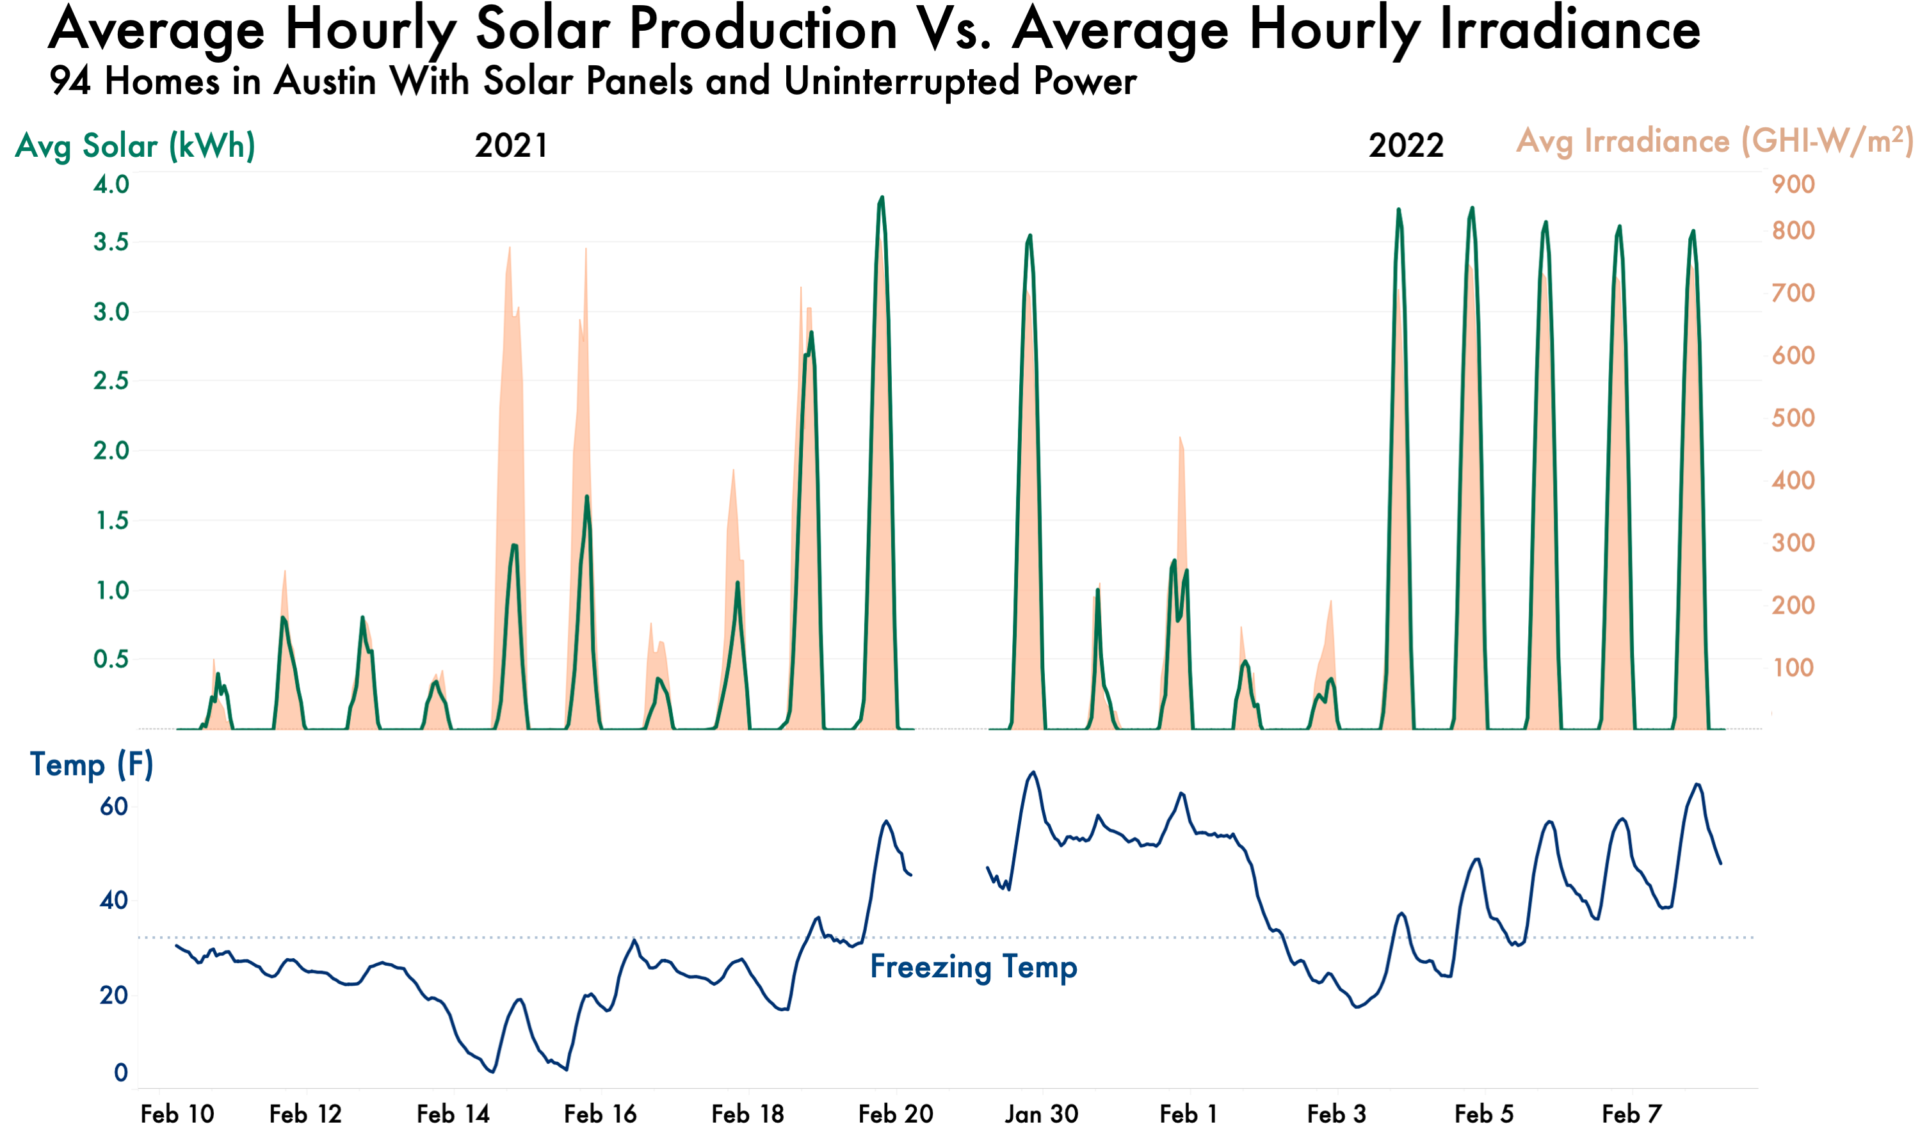
Figure B – Average Hourly Solar Production Vs Hourly Irradiance
Residential solar provided critical kilowatts of power during both storms. While Uri’s snow reduced production for two days, the ice of the most recent storm had a smaller effect before melting and returning to full production on Friday. Figure B shows the solar production vs. irradiance in the same sample of homes during both storms. During Uri, solar production dropped to around 70% of normal production due to snow on panels on Tuesday and Wednesday before recovering later in the week. The 2022 storm deposited a sheet of ice on solar panels on February 3, but the sky was too cloudy for much solar production anyway. The ice melted quickly in bright sunlight the following day which led to solar panels producing electricity at full capacity.
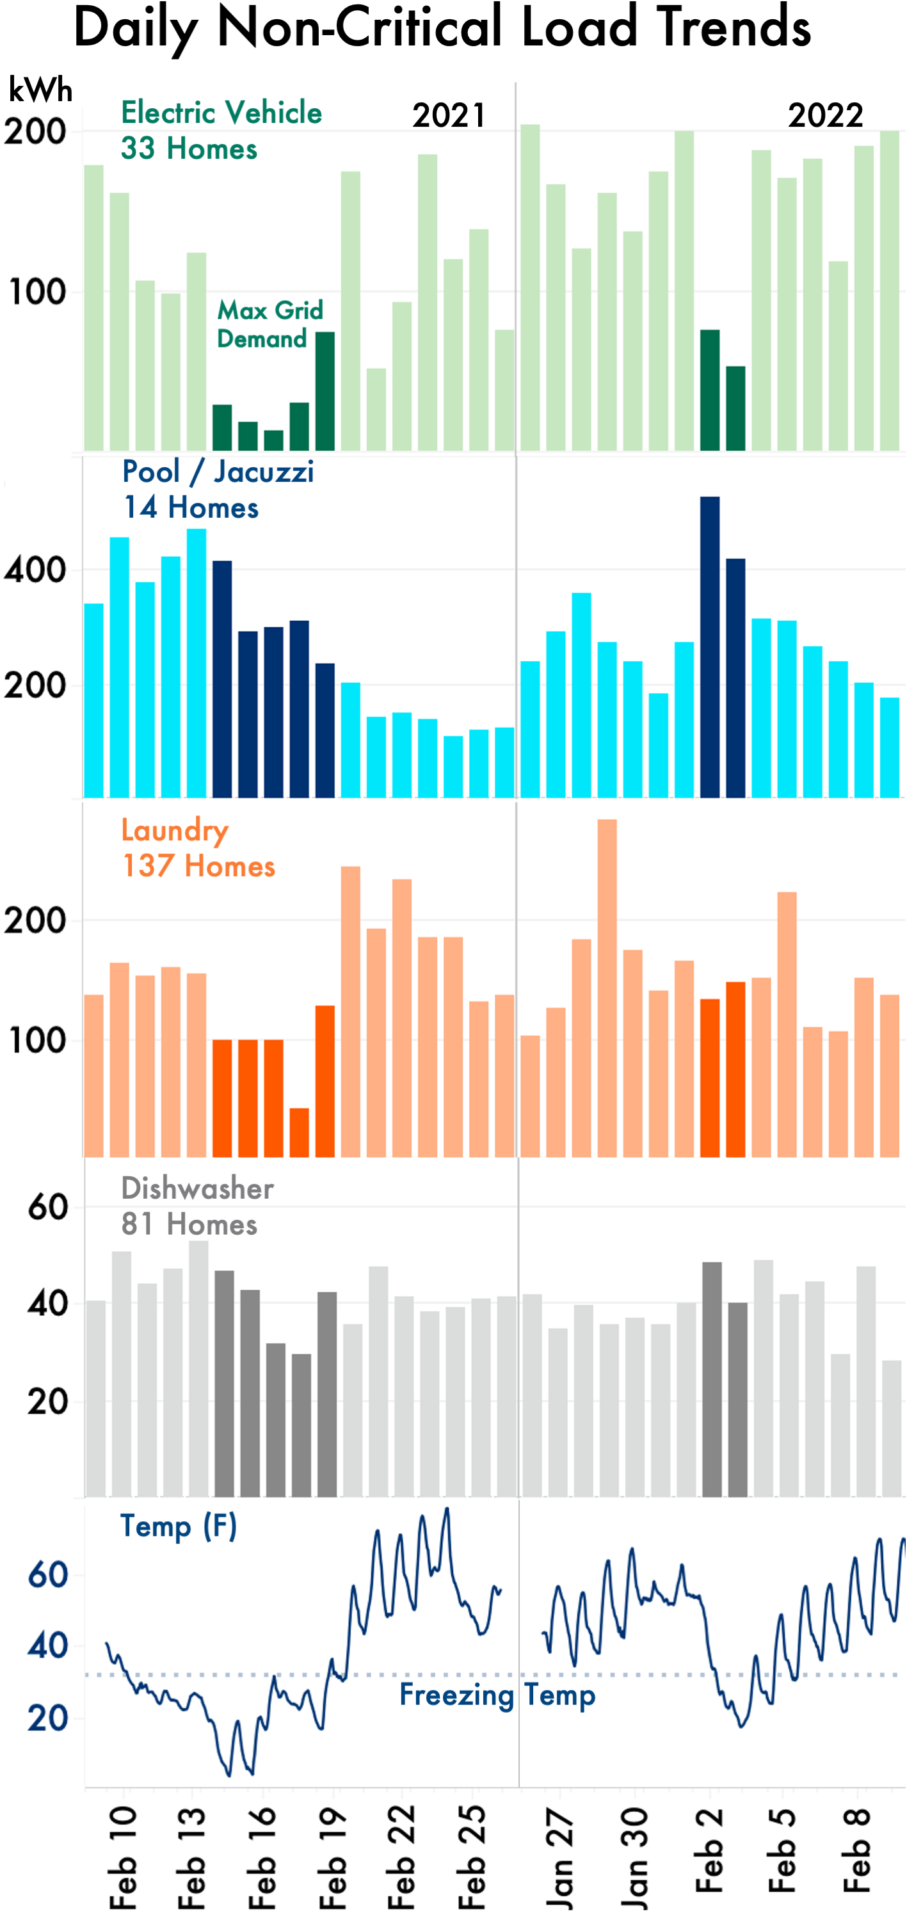
Figure C – Daily Non-Critical Load Trends
Figure C shows the daily electric demand of various non-critical home loads in the same homes during both winter storms. Electric vehicle charging was lower than normal during both events. However, the 2022 storm saw more charging in the days before the event, perhaps due to increased caution and public awareness after last year. System operators and planners will have to account for future pre-event surges as more and more of the economy is electrified. Pool equipment, laundry and dishwashing load was slightly lower during last year’s storm, but not in 2022, which highlights a great opportunity for future demand response. There’s still plenty of demand to trim.