June 26, 2019
 By Grant Fisher, chief information officer, Pecan Street
Thanks to feedback and requests from users like you and a grant from the Alfred P. Sloan Foundation, Dataport is now better than ever.
Most importantly, the Dataport website has moved to dataport.pecanstreet.org. The old address will redirect you, but be sure to bookmark the new URL for future use.
In addition, the redesigned site features a more user-friendly interface that makes it easier to find and use the data you need.
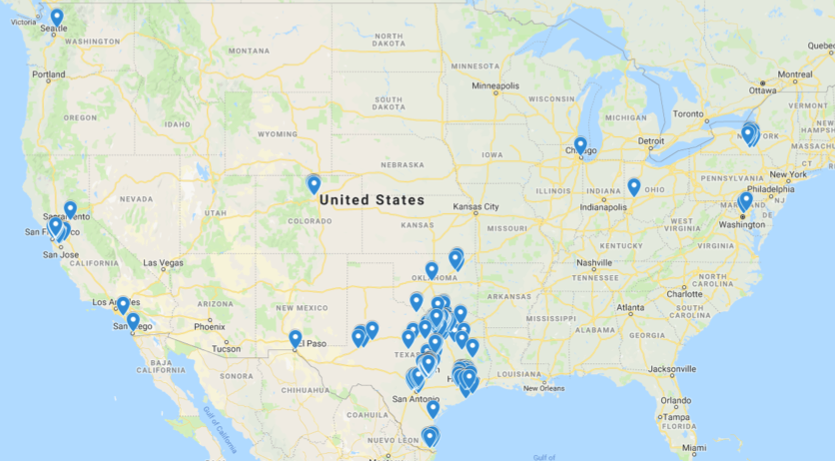
We began collecting real power data in 2012 for homes within Austin. Over the past few years, our scope has grown to include 50 homes in San Diego, 50 homes in Boulder, and another 50 homes scattered around the United States. Pecan Street is now taking on our largest expansion to date in geography, time series, and scope of data.
- Throughout 2019, we will add 100 homes to our dataset from New York and 100 homes from California.
- We’ve begun upgrading our data collection instrumentation from 1-minute interval data to 1-second interval data.
- We’ve added five new types of data in addition to real power: apparent power, phase angle, total harmonic distortion (THD), voltage, and current.
- We’ve completed an overhaul of our data loading system, thereby loading in near real-time data instead of the previous bi-monthly loads.
The new datasets will provide important climate and sociodemographic diversity to Dataport’s data. The New York and California datasets will also support the clean energy market, regulatory and policy experimentation underway in these two trailblazing energy states.
Geographic Expansion
The majority of Pecan Street’s research network is in Texas and has been participating for over five years. The new research networks in New York and California will provide important climate and sociodemographic diversity to Dataport’s data, in addition to serving as regional innovation testbeds.
New York’s REV (Reforming the Energy Vision) has made energy research and development a key economic driver for the state. California is supporting a rapid transformation of the electric grid and integration of distributed energy resources, including a goal to have all new construction zero-net-energy by 2030 and a requirement that all new construction include solar PV.
On the new Dataport site, you will already be able to access data from 75 homes in New York and a handful of homes from California. The remainder of homes in these two new regions will come online throughout 2019.
Deeper Dive Into Power Characteristics of Homes
Our team worked closely with our sensor provider, eGauge, to extract even more data out of the systems we already have installed. These new data points will be available starting July 1, 2019, for all of our University-level licensees and Dataport Unlimited Commercial licensees:
Real Power – Also referred to as true power, real power is the actual amount of power being used. Real power is measured in watts (P). Each circuit we collect data from will include real power. The real power data in Dataport dates as far back as 2012 and is available at 1-hour, 15-minute, 1-minute, and 1-second (starting in 2017) intervals for over 500 homes.
Apparent Power – Apparent power is the combination of real and reactive power and is the product of voltage RMS and current RMS. Apparent power is measured in volt-amperes (VA). Each circuit we collect data from will include apparent power. The apparent power data becomes prevalent in the database in 2019 and is available at 1-hour, 15-minute, 1-minute, and 1-second intervals for over 500 homes.
Voltage – Pecan Street collects voltage data for both legs of a residential split-phase system and releases the data as Leg1 and Leg2 voltage. The voltage data in Dataport dates as far back as 2012 and is available at 15-minute, 1-minute, and 1-second intervals (starting in 2018) for over 500 homes.
Phase Angle – Pecan Street collects the phase angle between the voltage and current on all available circuits at an installation. Inductive circuits will have a positive phase angle since current lags the voltage in an inductive circuit. The phase is negative for a capacitive circuit since the current leads the voltage. The phase angle data becomes prevalent in the database in 2019 and is available at 15-minute, 1-minute, and 1-second intervals for over 500 homes.
Current – Current, or the flow of electrons, is captured for each of the circuits within a home. Current is measured in amps (A). The current data becomes prevalent in the database in 2019 and is available at 15-minute, 1-minute, and 1-second intervals for over 500 homes.
Total Harmonic Distortion – Total harmonic distortion is a measure of waveform distortion on an electrical service up to the tenth harmonic. THD is typically created by switching power supplies, variable speed drives, and motor loads. The THD data becomes prevalent in the database in 2019 and is available at 15-minute, 1-minute, and 1-second intervals for over 500 homes.
As the upgrade to our field collection devices rolls out, these new data points will automatically flow directly into the Dataport database. Due to a change in our processing and loading of field data, the data collected from the eGauges will now be loaded into Dataport every hour. This allows for same-day calculations and analysis on energy data – keeping research relevant and up to date.
We’d love to know what you think of the new design and new data. Send us an email with any feedback or suggestions to dataport@pecanstreet.org.